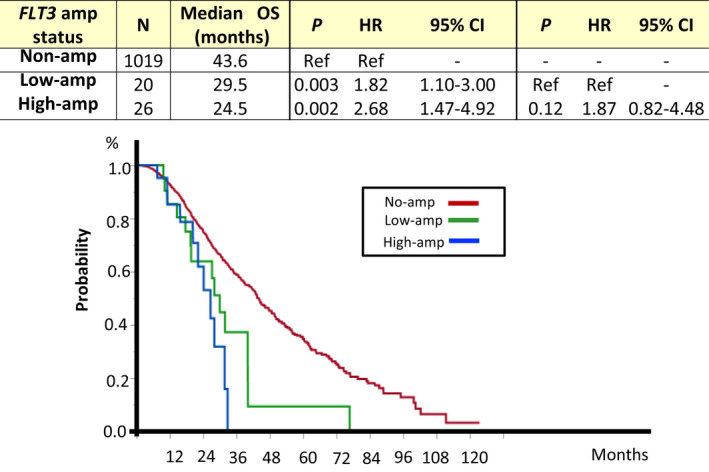
FIGURE 4.

Overall survival according to FLT3 amplification status. Kaplan‐Meier curve for patients with high FLT3 amplification (n = 26, blue) and low FLT3 amplification (n = 20, green), and those without FLT3 amplification (n = 1019, red). amp, amplification; CI, confidence interval; HR, hazard ratio; OS, overall survival
