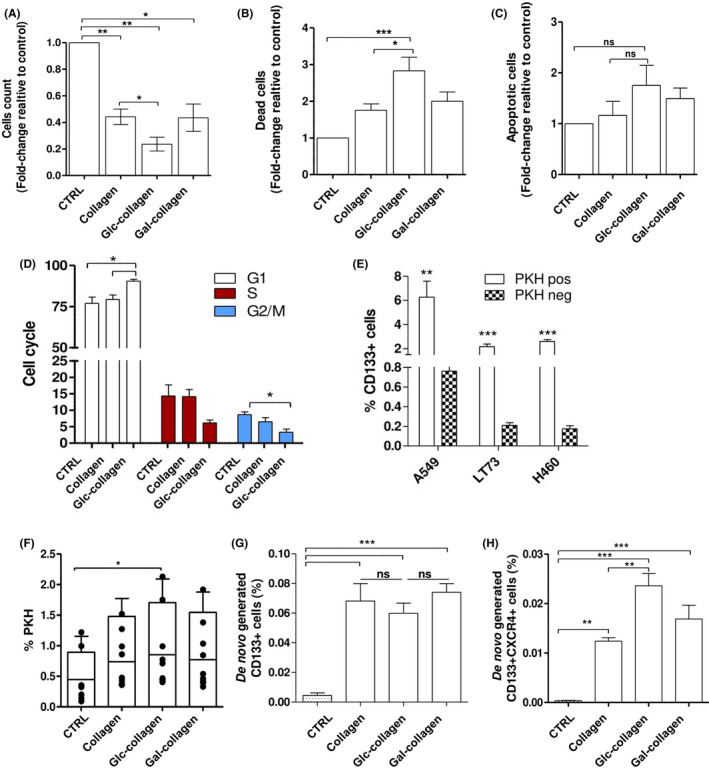
Figure 2.

Collagen films select slow‐dividing cancer stem cells (CSC) and promote their de novo generation. A, Count of vital cells (Trypan blue exclusion method) in A549, LT73 and H460 cells grown for 72 h on collagen films. Bars represent the median fold‐change of percentage of dead cells relative to culture plate condition ± SEM. n = 3 replicates for each cell line. One‐way ANOVA was used for statistical analyses. *P < 0.05; **P < 0.01. B, Quantification of dead cells (7‐AAD vital staining) and (C) apoptotic cells (Annexin V+, propidium iodide [PI]–) in A549, LT73 and H460 cells grown for 72 h on collagen films. Bars represent the fold‐change of percentage of dead cells relative to culture plate condition ± SEM. n = 3 replicates for each cell line. One‐way ANOVA was used for statistical analyses *P < 0.05; ***P < 0.001. D, Cell cycle analysis (PI staining) of A549, LT73 and H460 cells grown for 72 h on collagen films or in culture plates. Bars are the median value of n = 2 replicates for each cell line. One‐way ANOVA was used for statistical analyses. *P < 0.05. E, CD133 content within PKHpos and PKHneg cells. Student’s t test was used for statistical analyses; **P < 0.01; ***P < 0.001. F, FACS analysis for PKH+ cells inA549, LT73 and H460 3 weeks post PKH staining. Cells were cultured on collagen films or on plastic culture plates for 72 h prior to analysis. Mean ± SEM of n = 2 replicates for each cell line is shown. One‐way ANOVA was used for statistical analyses. *P < 0.05. G, FACS analysis for the expression CD133 in LT73 CD133neg cell line cultured for 72 h on collagen films. Bars are the % of CD133+ cells. n = 4 experiments. H, FACS analysis for the expression CD133+ and CXCR4+ in LT73 CD133neg cell line as in (G)
