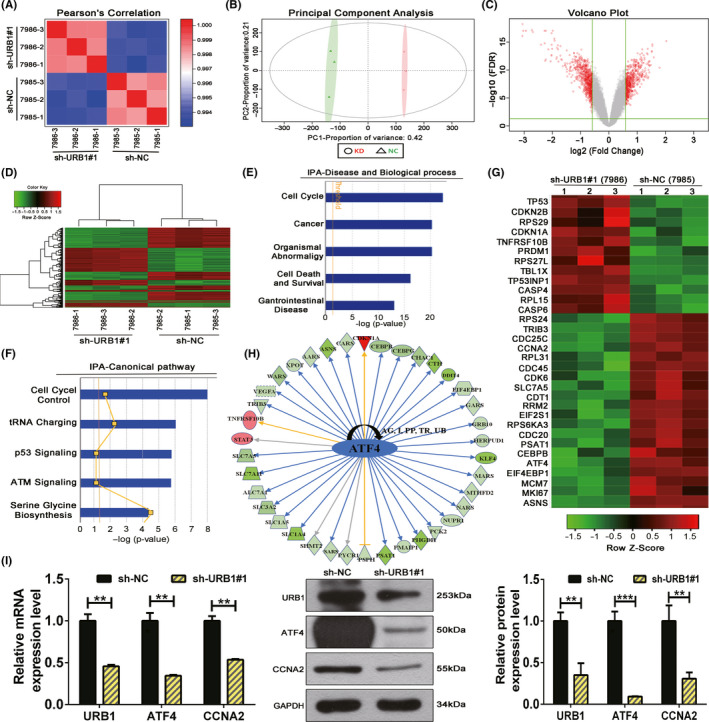
FIGURE 3.

Microarray screening and Ingenuity Pathway Analysis (IPA) suggest an oncogenic role for URB1 and predicted the differentially expressed genes (DEGs) involved in URB1‐related biological processes. A, B, Pearson’s correlation (A) and principal component analysis (B) were used to affirm the correlation and variation of experimental samples. C, Volcano plot was used to compare DEG expression profiles. D, Hierarchical clustering heatmap showing the mRNA expression profiles in the negative control (sh‐NC) and silencing (sh‐URB1#1) groups. E, F, Enrichment of the top five cell biological processes and canonical signaling pathways based on IPA analysis suggested the biological functions of URB1. G, Heatmap of 32 selected DEGs highly related to the biological processes and canonical pathways analyzed in E and F. H, Upstream regulator analysis of IPA revealed that the displayed DEGs can be demonstrably regulated by URB1 through a downstream target, activating transcription factor 4 (ATF4). I, Quantitative RT‐PCR and western blotting verified the positive regulation of ATF4 by URB1. Data are expressed as mean ± SD (n = 3). **P < .01, ***P < .001. CCNA2, cyclin A2
