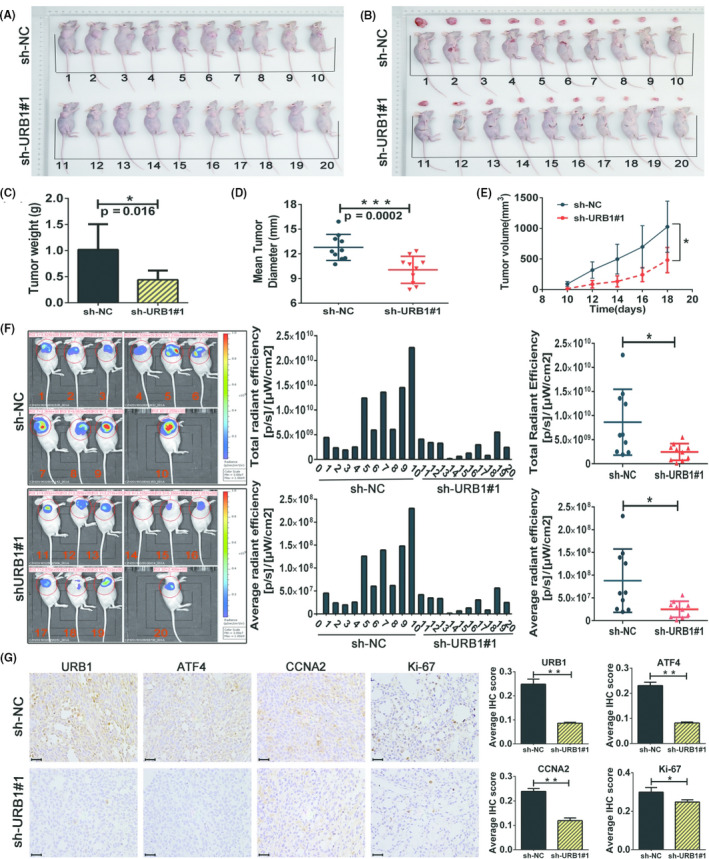
FIGURE 7.

Silencing of URB1 inhibits colorectal cancer cell proliferation in vivo. A, B, Images of s.c. xenografts from URB1 silenced (sh‐URB1#1) and negative control (sh‐NC) groups (n = 10). C‐E, Comparison of tumor weight (C), mean tumor diameter (D), and tumor volume growth curves (E) for s.c. xenografts of the indicated groups. F, In vivo fluorescence imaging (left panel) and GFP intensity analysis (middle and right panels) show the different growth status of xenografts between the indicated groups (n = 10). G, Immunohistochemistry staining to detect the regulatory effect of URB1 on activating transcription factor 4 (ATF4), cyclin A2 (CCNA2), and Ki‐67 expression in vivo. Scale bar = 50 μm (×400 magnification). Data are expressed as mean ± SD (n = 5). *P < .05, **P < .01, ***P < .001
