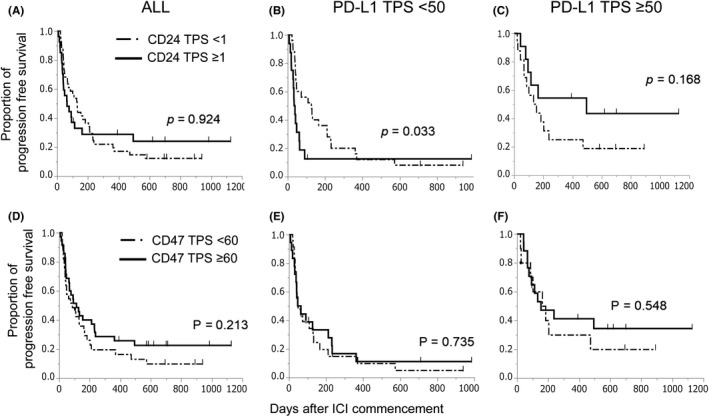
FIGURE 2.

A‐C, PFS curves of CD24 TPS ≥ 1 and < 1 for ICI treatment. A, All patients. B, Patients with PD‐L1 TPS < 50. C, Patients with PD‐L1 TPS ≥ 50. D‐F, PFS curves of CD47 TPS ≥ 60 and < 60 for ICI treatment. D, All patients. E, Patients with PD‐L1 TPS < 50. F, Patients with PD‐L1 ≥ 50
