
Fig. 5.
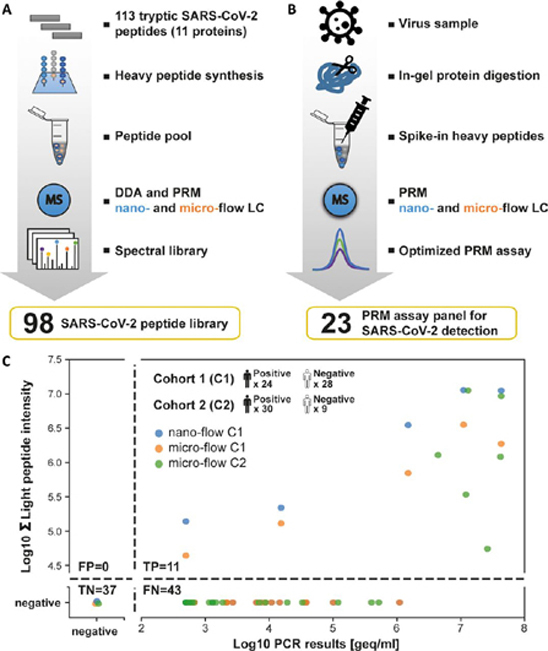
PRM assays for SARS-CoV-2 detection in clinical samples.A, Flow chart illustrating the generation and characterization of a synthetic SARS-CoV-2 peptide and spectral library. B, Flow chart for the optimization of a PRM assay panel for SARS-CoV-2 detection. C, Comparison of SARS-CoV-2 detection in clinical samples by PCR and PRM. Two cohorts (C1 and C2) of in total 54 PCR-positive and 37 PCR-negative diagnostic samples were analyzed. The semi-quantitative data of the PRM (summed endogenous (light) intensity) and PCR (genome equivalents, geq) assays are plotted against each other. The number of false positive (FP), true positive (TP), true negative (TN), and false negative (FN) cases were computed based on the PCR data as ground truth. Cohort 1 was measured by nano- and micro-flow PRM. Cohort 2 was only analyzed by micro-flow PRM.