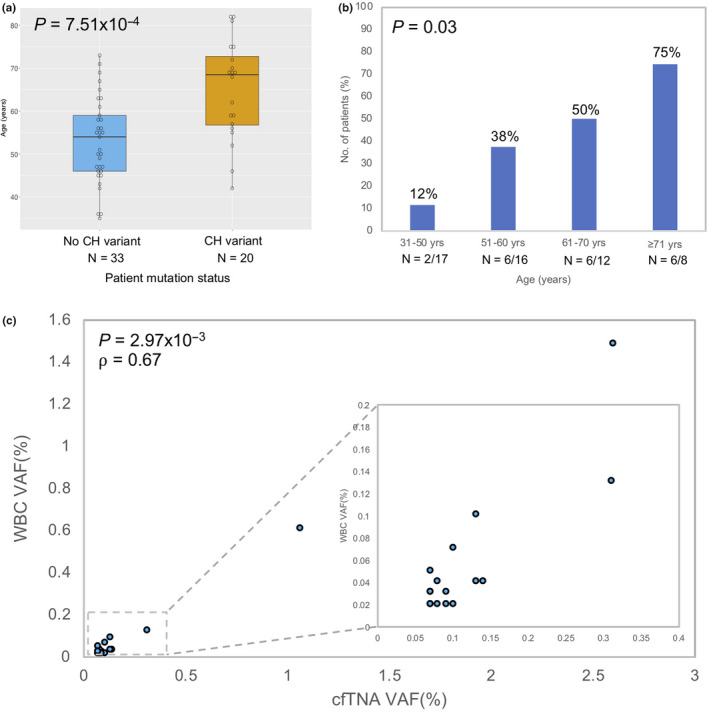
Figure 2.

Clonal hematopoiesis (CH) variants characteristics. A, Association between CH variant occurrence and age in breast cancer patients, total samples, n = 53. P‐value was calculated using the Mann‐Whitney U test. Horizontal line represents median, box represents IQR and the whiskers denote 1.5 × IQR on either side. B, CH variant detection rates in different age groups, total samples, n = 53. P‐value was calculated using χ2 2‐sided test of independence. Number of patients shown below each corresponding bar. C, Correlation between cell‐free total nucleic acid (cfTNA) variant allele frequency (VAF) and white blood cell (WBC) VAF in variants found in both cfTNA and WBC sequencing. P‐value and correlation coefficient (⍴) were calculated using Spearman’s rank correlation test
