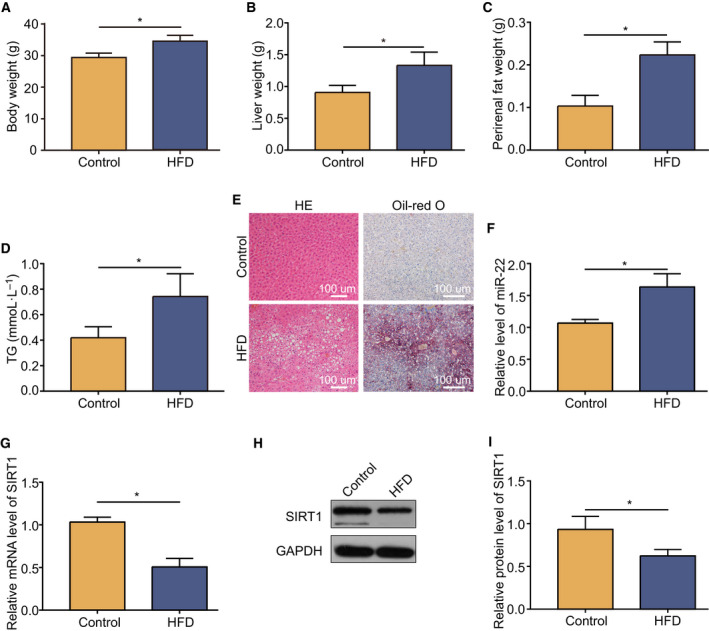
Fig. 1.

Upregulation of miR‐22 and downregulation of Sirt1 in the obesity mouse model. Weight changes of the body (A), liver (B), and perirenal fat (C) in the NAFLD model. (D) TG concentration in the obesity model. (E) HE and Oil Red O stained liver tissues at 100× magnification. Scale bars: 100 µm. The level of miR‐22 (F) and Sirt1 mRNA (G) in the obesity mouse model compared with control tissues examined by quantitative real‐time PCR. (H) Western blot analysis of Sirt1 protein expression in the obesity model and control. (I) Downregulation of Sirt1 protein expression in the obesity model. Data were presented as mean ± SD for three independent experiments. Student’s t‐test was conducted. * P < 0.05.
