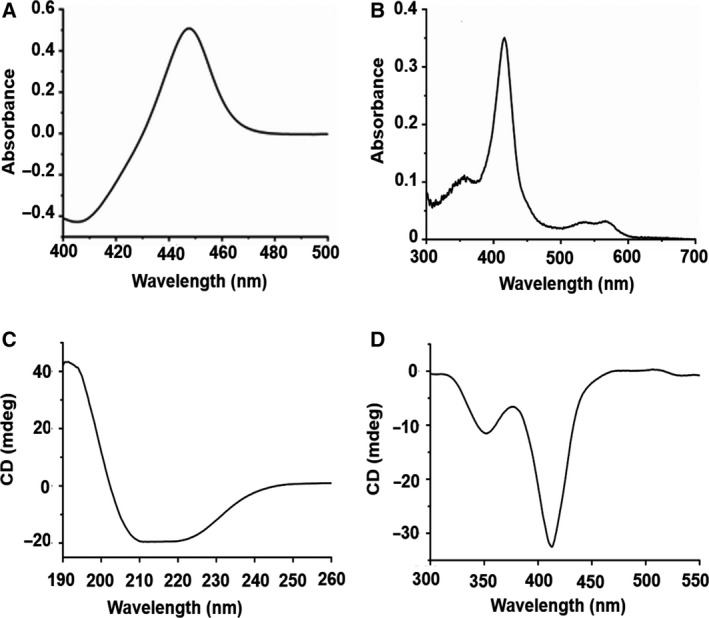
Fig. 1.

Spectral characteristics of P450‐T2. (A) The FeII‐CO complex of P450‐T2 showed a maximal absorption at 450 nm. (B) UV‐Vis spectroscopy of the purified P450‐T2. CD spectra of P450‐T2 in the far‐UV (C) and near‐UV‐Vis (D), which were recorded with 4 and 20 µm enzyme, respectively, in 10 mm potassium phosphate buffer (pH 7.4) at 25 °C.
