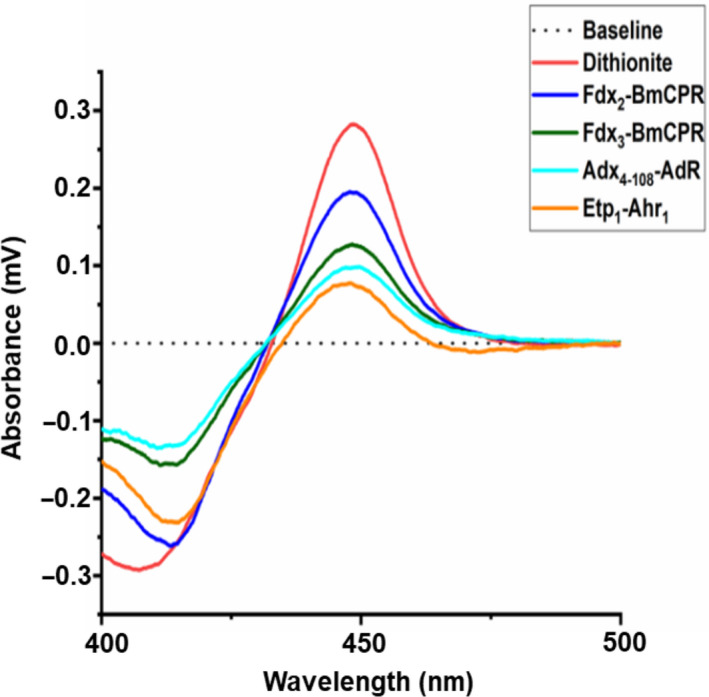
Fig. 3.

Screening of electron transfer partners for P450‐T2. The dithionite reduced CO‐difference spectrum (red line) was compared with the CO‐complex spectrum after reduction by truncated Adx4–108–AdR (cyan line), Etp1–Arh1 (orange line), Fdx2–BmCPR (dark green line) and Fdx3–BmCPR (blue line). The baseline is performed in a black dotted line. A 1 mL mixture of CYP : ferredoxin : ferredoxin reductase of 1 : 40 : 5 (0.25 µm P450‐T2: 10 µm Fdx : 1.25 µm FdR) in 50 mm HEPES buffer (pH 7.4). NADPH solution (1 mm) was supplemented for starting the reduction.
