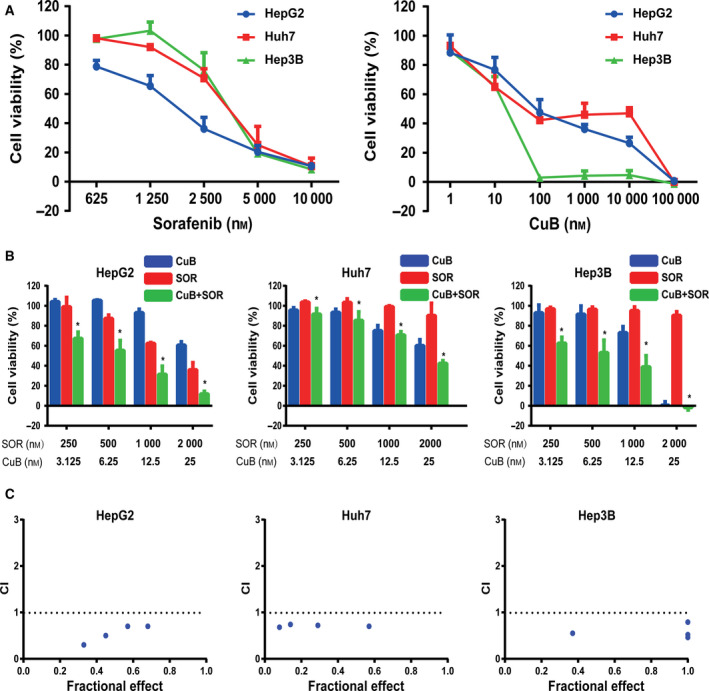
Fig. 1.

The synergistic antiproliferative effects of sorafenib and CuB in HCC cells. (A) Following treatment with the indicated concentrations of sorafenib and CuB alone for 48 h, IC50 values of sorafenib and CuB alone in HepG2, Huh7 and Hep3B cells were calculated using prism after the CCK‐8 assay. (B) HCC cells were treated with the indicated concentrations of sorafenib and/or CuB for 48 h. Cell viability was assessed by the CCK‐8 assay. (C) The Fa‐CI plot indicated the CI values via calcusyn. CI < 1, CI = 1 and CI > 1 represent synergistic, additive and antagonistic effects, respectively. Data are presented as the mean ± SD from three independent experiments. Differences between two groups were analyzed using Student’s t‐test. *P < 0.05 vs. sorafenib. SOR, sorafenib; CuB, cucurbitacin B.
