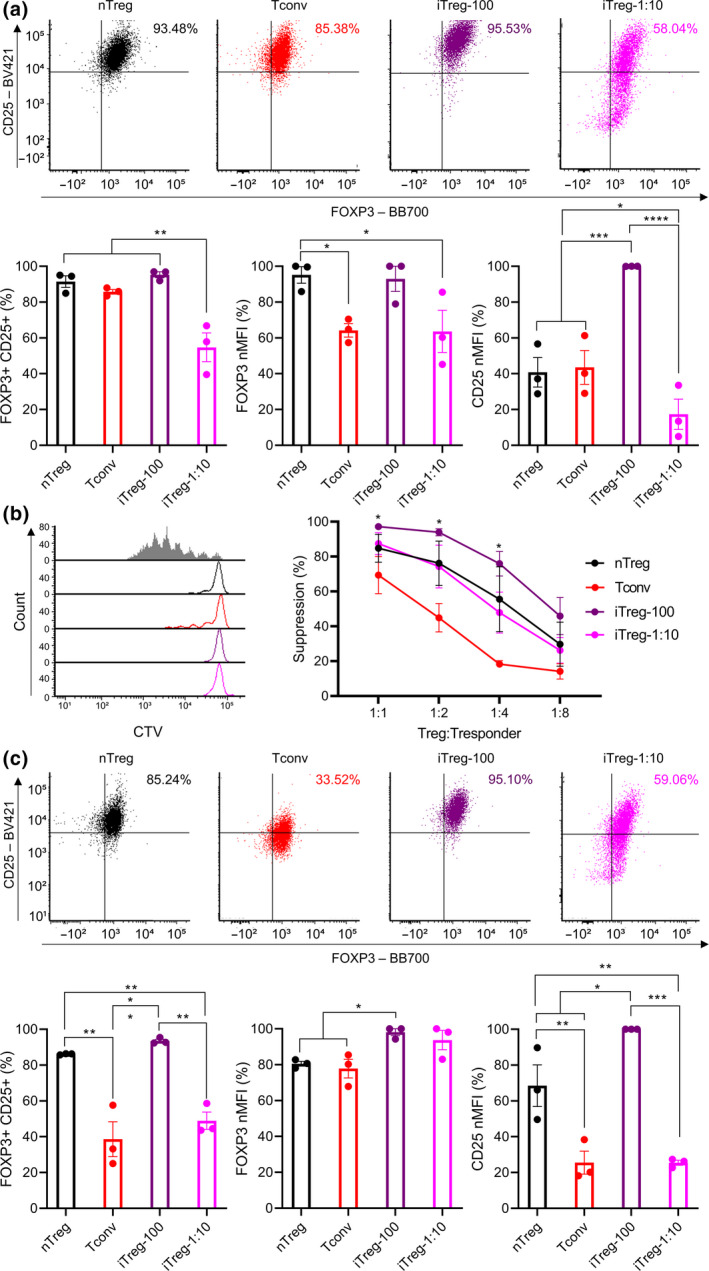
Figure 3.

The impact of α‐CD3/C28 bead ratios on iTreg differentiation. Naïve nTregs were stimulated with a 1:1 α‐CD3/CD28 beads and IL‐2 (nTreg). Naïve CD4+ T cells were mock‐stimulated with a 1:1 α‐CD3/CD28 beads and IL‐2 (Tconv). iTregs were differentiated from naïve CD4+ T cells using IL‐2 TGF‐β, ATRA and 100 ng mL−1 rapamycin and various ratios of α‐CD3/CD28 beads (1:1 and 1:10 bead to cell; iTreg‐100 as before and iTreg‐1:10). Following a 7‐day stimulation, cells were rested up to 7 days with IL‐2. After 3 days of rest, (a) expression of FOXP3 and CD25 (b) suppressive activities were evaluated. After 7 days of rest, (c) expression of FOXP3 and CD25 was evaluated. MFI of FOXP3 and CD25 were normalised to highest raw MFI value in each experiment and represented as nMFI (%). Raw MFI for (a and c) is shown in Supplementary figures 9 and 10, respectively. For (b), grey‐shaded histogram represents positive control (no Treg control). Data are represented as mean ± sem, N = 3 in three independent experiments. For each donor (N), technical triplicates were utilised, and the average of technical replicates was used for each datapoint. Statistical significance identified by RM one‐way (a and c) and RM two‐way (b) ANOVA with Dunnett’s multiple comparisons test: *P < 0.05, **0.01, ***0.001, ****0.0001.
