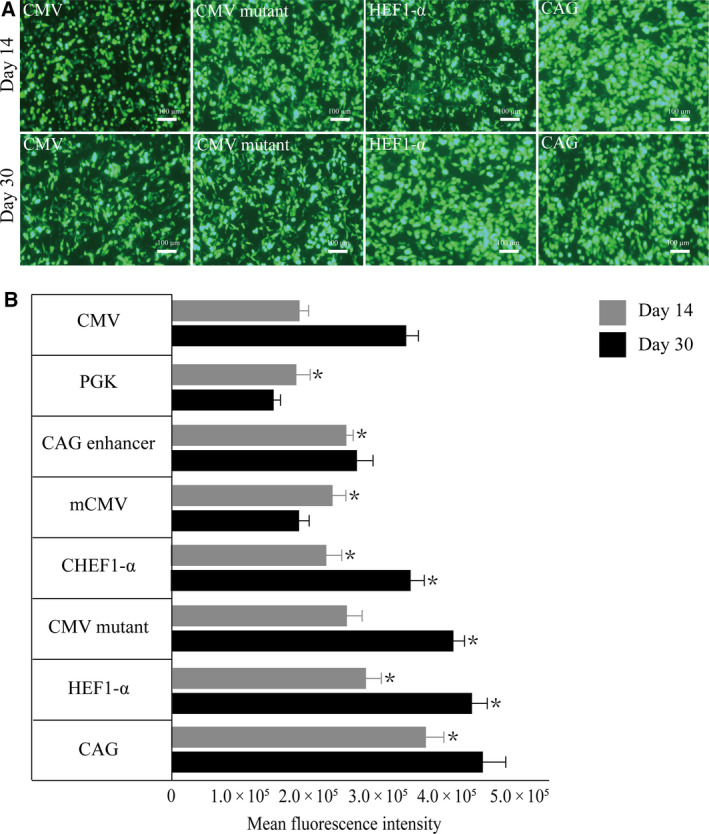
Fig. 3.

Cells were collected 14 and 30 days after transfection, respectively, and eGFP expression levels were detected by fluorescence microscopy and flow cytometry. (A) The fluorescent expression level was detected at 14 and 30 days after transfected with four high‐expression promoter: CAG, HEF1‐α, CMV mutant, and CMV, scale bars: 100 μm. (B) Flow cytometry analysis of eGFP stable expression at 14 and 30 days after transfection, and the eGFP MFI was normalized to CMV promoter. All the experiments were repeated three times. SEM is indicated (Student’s t‐test, *P < 0.05).
