
Fig. 7.
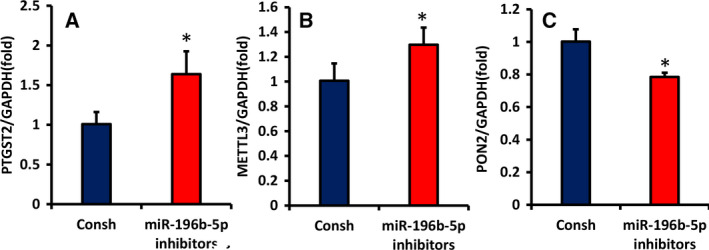
The mRNA levels of differentially expressed proteins in WJCMSCs induced by miR‐196‐5p. (A–C) Real‐time RT‐PCR analyzed the mRNA level of PTGS2, METTL3 and PON2 in miR‐196b‐5p inhibitors and the control group. GAPDH was used as an internal control for real‐time RT‐PCR. Student's t‐test was used to analyze the statistical significance. All error bars signify standard deviations (n = 3). *P ≤ 0.05.