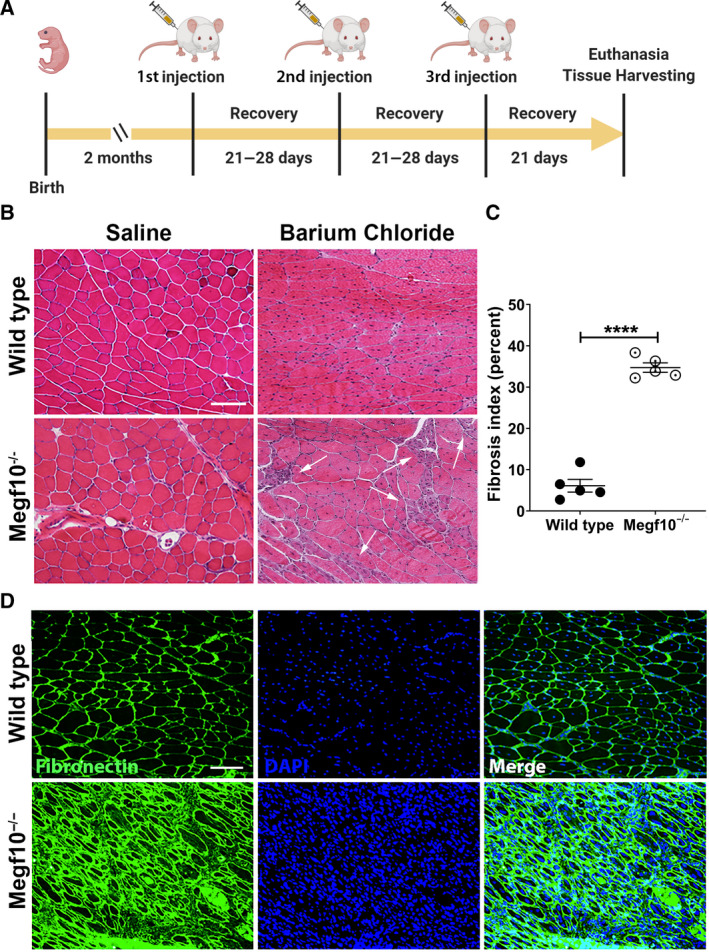
Fig. 3.

(A) Timeline of mouse injury experiments, showing intervals between birth, 3 sequential barium chloride and saline (control) injections into tibialis anterior, and euthanasia followed by tissue harvesting. (B) Hematoxylin and eosin staining of sections from tibialis anterior muscles that were injected with either barium chloride or saline in wild‐type and Megf10−/− mice. Arrows in the barium chloride Megf10−/− image indicate clusters of small myofibers with internalized nuclei; such clusters are not present in the barium chloride wild‐type image. Scale bar, 100μm. (C) Fibrosis quantification was performed on 5 images of fibronectin stained sections of tibialis anterior muscles injected with barium chloride in wild‐type and Megf10−/− mice. The percent fibrosis index was calculated as fibrotic area/total area × 100, indicated as percentages. An unpaired t‐test and one‐way ANOVA both yielded P < 0.0001 between wild‐type and Megf10−/− groups. Scatter plots represent fibrosis indices from n = 5 images; mean ± SEM shown; ****, P < 0.0001. (D) Representative IF images of muscle sections show fibronectin (green) with DAPI (blue) counterstaining in barium chloride injected tibialis anterior muscles from wild‐type and Megf10−/− mice. Scale bar, 100 μm.
