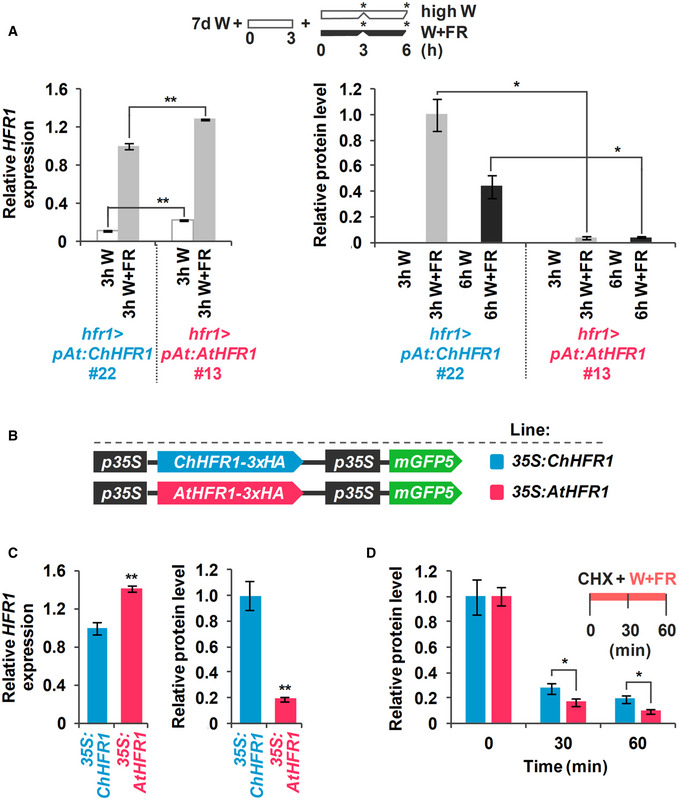
Figure 4. ChHFR1 and AtHFR1 proteins show different stability in shade.

- Expression of HFR1 and protein levels of HFR1‐3xHA in seedlings of hfr1>pAt:ChHFR1 (line #22) and hfr1>pAt:AtHFR1 (line #13). Seedlings were grown for 7 days in continuous W (~ 20 µmol/m2·s1) after which they were incubated for 3 h in high W (~ 100 µmol/m2·s1) and then either kept at high W or transferred to W + FR (R:FR, 0.06) for 3 or 6 h, as indicated in the cartoon at the top. Relative HFR1 transcript levels, normalized to UBQ10, are the means ± SE of three independent biological replicates relative to hfr1>pAt:ChHFR1 #22 grown for 3 h under W + FR. Relative protein levels, normalized to actin, are the means ± SE of three independent biological replicates relative to hfr1>pAt:ChHFR1 #22. Samples were collected at data points marked in the cartoon with asterisks.
- Cartoon of constructs containing ChHFR1 or AtHFR1 under the 35S promoter used for transient expression of transgenes in N. benthamiana leaves.
- Relative HFR1 transcript levels transiently expressed in tobacco leaves, normalized to the GFP, are the means ± SE of three independent biological replicates (left). Relative HFR1 protein levels, normalized to the GFP levels, are the means ± SE of four independent biological replicates (right). In (A) and (C), asterisks mark significant differences (Student's t‐test: *P‐value < 0.05, **P‐value < 0.01) between the indicated pairs.
- Degradation of ChHFR1 (35S:ChHFR1) and AtHFR1 (35S:AtHFR1) in tobacco leaf disks treated with cycloheximide (CHX, 100 µM) for the indicated times. Tobacco plants were kept under high W (~ 200 µmol/m2·s1) for 3 days after agroinfiltration and then leaf circles were treated with W + FR (R:FR, 0.2) and CHX. Relative HFR1 protein levels (ChHFR1, blue bars; AtHFR1, red bars), normalized to the GFP levels, are the means ± SE of four biological replicates relative to data point 0, taken as 1 for each line. Asterisks mark significant differences (2‐way ANOVA: *P‐value < 0.05) between ChHFR1 and AtHFR1 at the same time point.
Source data are available online for this figure.
