
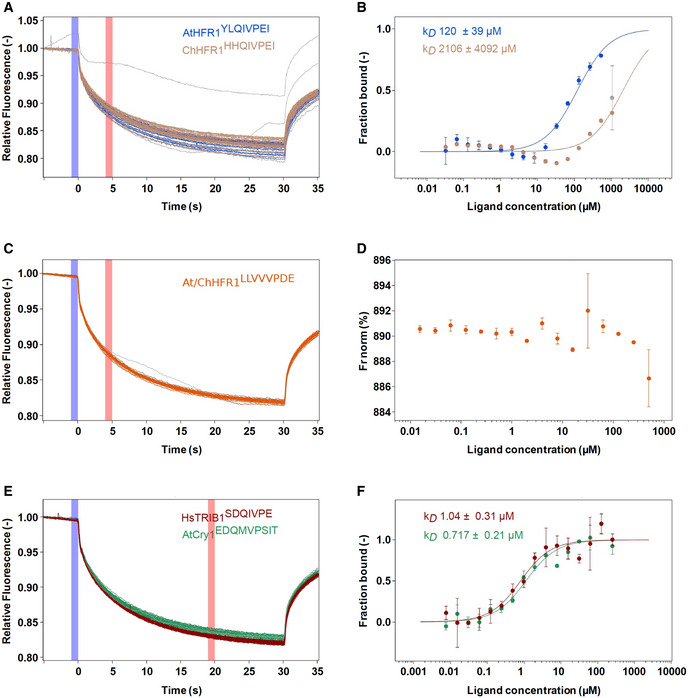
Figure EV5. Microscale thermophoresis (MST) experimental traces and analysis.
-
A–FRaw MST traces and analysis of AtCOP1 WD40 with different peptides in triplicates (duplicates for At/ChHFR1 VP). The concentration of AtCOP1 WD40 is fixed at 0.15 μM mixed with 16 serially diluted peptide concentrations at 1:1 ratio. Panels A, C, and E show the normalized MST traces. The blue box area illustrates the fluorescence before activation of the infrared (IR) laser and red box area illustrates average fluorescence after activation of the IR laser. Average values ± SD (error bars) were subsequently used for fluorescence normalization. kD fit displaying fraction bound as a function of ligand concentration is shown in adjacent right panels B, D, and F. (A) Raw MST traces for AtHFR1 (in blue) and ChHFR1 (in light‐brown) VP peptides. Individual concentrations that showed slight aggregation or precipitation are shown in gray and were excluded from the kD fit calculation. (B) Fitted data over a concentration range from 0.032 to 500 μM for AtHFR1 VP (blue dots) and 0.032 to 1,000 μM for ChHFR1 VP (light‐brown dots) were used to derive the corresponding dissociation constant kD. (C) Raw MST traces for At/ChHFR1 VP peptide (in orange). One concentration that showed slight precipitation or aggregation is shown in gray. A concentration range of 0.0154 to 506 μM was used for the At/ChHFR1 VP. (D) No kD was determined, as no binding between COP1 WD40 and the At/ChHFR1 VP peptide (orange dots) was detected. (E) A concentration range from 0.0076 to 250 μM for HsTRIB1 (in red) and AtCRY1 (in green) peptides was used. Raw MST traces show no aggregation or precipitation effects during this binding. One AtCRY1 VP outlier is shown in gray. (F) The kD for HsTRIB1 (brown dots) and AtCRY1 (green dots) VP peptides was calculated using the normalized traces.