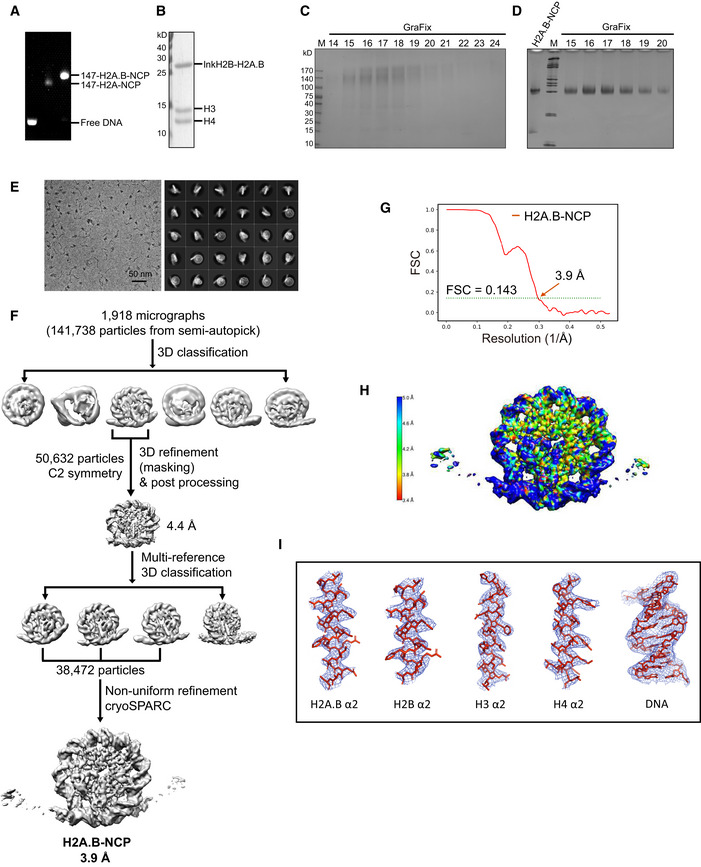
Figure EV1. Biochemical characterization and data processing of the H2A.B‐NCP .

-
ANative‐PAGE analysis of the purified human H2A‐NCP and H2A.B‐NCP.
-
BSDS–PAGE analysis of the purified human H2A.B‐NCP. The linked H2B‐H2A.B dimer (lnkH2B‐H2A.B) was used for nucleosome reconstitution.
-
C, DSDS–PAGE (C) and Native‐PAGE (D) analyses of pre‐crosslinked H2A.B‐NCP subject to GraFix treatment. Peak fractions (18–19) containing intact H2A.B‐NCP were processed for further electron microscopy analysis. Experiments were repeated multiple times (n > 5).
-
DRepresentative cryo‐EM image (left) and 2D class averages (right) of H2A.B‐NCP particles.
-
EFlowchart of data processing of the H2A.B‐NCP.
-
FFSC curve of the final density maps of the H2A.B‐NCP. Reported resolutions were based on the FSC = 0.143 criteria.
-
GThe final 3D density map of H2A.B‐NCP shown in the indicated views is colored according to the local resolution estimated by the software ResMap.
-
HExamples of cryo‐EM density maps of the histones and DNA generated in Pymol.
