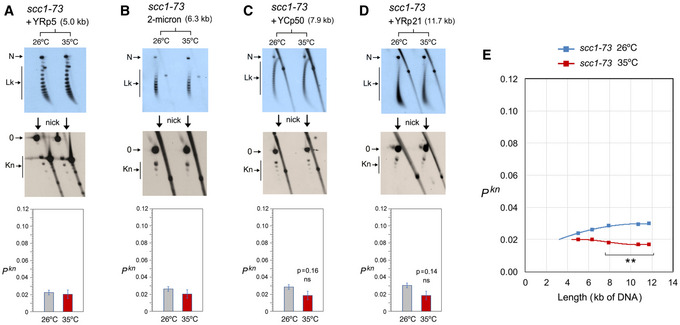
Figure 5. DNA length dependence of the topological effects of cohesin inactivation.

-
A–DDNA topology of the indicated minichromosomes of increasing DNA length (kb) before (26°C) and after inactivation of cohesin (35°C) in scc1‐73 cells. In each case, the first 2D gel resolves the Lk topoisomers (Lk), the second 2D gel uncovers the knotted forms (Kn). Gel signals are denoted as in Fig 2. Bottom graphs compare the Pkn before and after the inactivation of cohesin (mean ± SD from three independent experiments). P‐values (Student’s t test): ns, P > 0.05.
-
EPlot of Pkn values of minichromosomes of increasing DNA length (including YEp13) before and after inactivation of cohesin. P‐values (Student’s t test): **P < 0.01.
