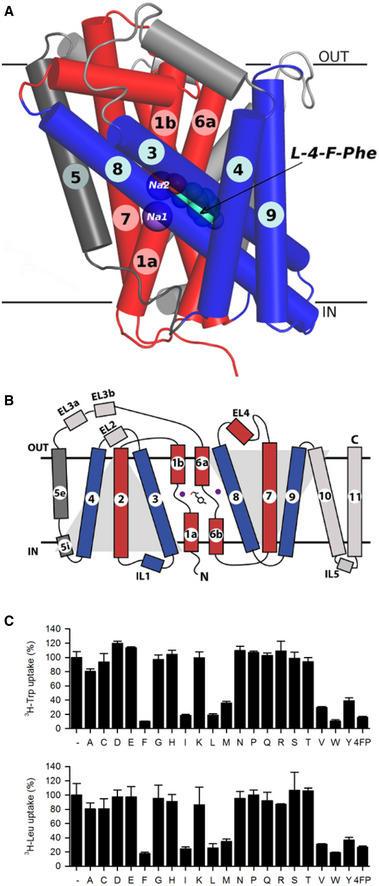
Figure 1. Overview of MhsT structure and function.

- MhsT is shown in a ribbon representation (scaffold helices in blue, bundle helices in red, and TM5 in dark gray, sodium ions shown as purple spheres, L‐4‐Fluoro‐phenylalanine, bound between unwound region of TM1 and TM6, shown as green spheres.
- Schematic representation of the MhsT structure (LeuT fold). L‐4‐Fluoro‐phenylalanine shown as gray sticks. Remaining color coding same as in panel A.
- Results of a competitive uptake assay showing inhibition of 0.2 µM L‐[3H]Trp or L‐[3H]Leu uptake in MhsT‐WT‐expressing MQ614 cells, measured for 30 s in the absence (−) or presence of 12 µM of the natural amino acids (the one‐letter code is used) or 4‐fluoro‐phenylalanine (4FP). Data are the mean ± SEM of three independent experiments each performed as technical triplicates.
