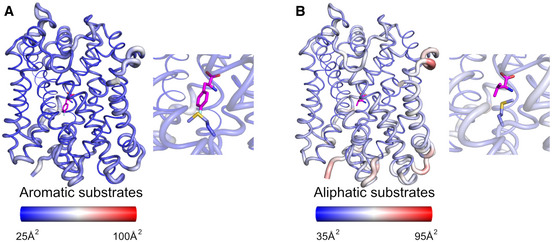
Figure 4. Structural flexibility analysis of the MhsT‐substrate complexes.

-
A, BStructural flexibility analysis of MhsT in complex with (A) L‐4‐F‐Phe and (B) L‐Val as representatives of the aromatic and aliphatic substrates, respectively. Ligands are shown as magenta sticks. The analysis was visualized by atomic putty and thermal gradient representation of B‐factor in Pymol. Red color indicates a high degree of disorder, while blue color indicates a low degree of disorder. In the inset, the substrates as well as the GMG loop are highlighted.
