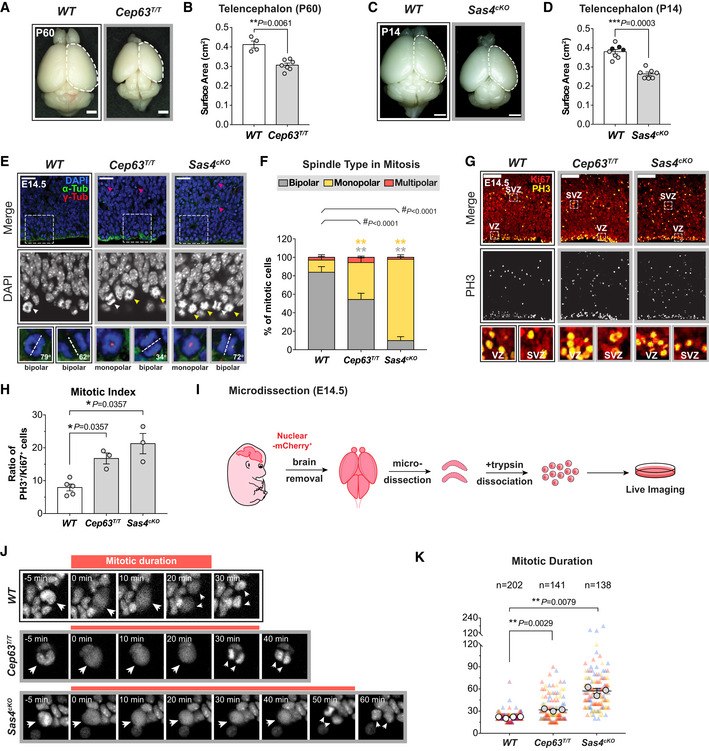
Figure 1. NPCs with centrosome defects delay in mitosis.

- Representative whole mount images of WT and Cep63T/T brains at P60. Scale bar = 0.2 cm.
- Telencephalon area of WT and Cep63T/T brains. WT littermates N = 4, Cep63T/T N = 7; two‐tailed Mann–Whitney t‐test.
- Representative whole mount images of WT and Sas4cKO brains at P14. Scale bar = 0.2 cm.
- Telencephalon area of WT and Sas4cKO brains. WT littermates N = 8, Sas4cKO N = 7; two‐tailed Mann–Whitney t‐test. Black circles represent Nestin‐Cre+ animals.
- Representative images of E14.5 WT, Cep63T/T, and Sas4cKO cortices stained with antibodies against α‐tubulin (green), γ‐tubulin (red), and DAPI (blue). Magenta arrows indicate dead cells; white and yellow arrows indicate cells with bipolar and monopolar spindles, respectively. Insets showing zoomed in view of DAPI and 2 representative cells. Dashed lines showing the orientation of the cleavage plane relative to the ventricular surface. Scale bar = 25 μm.
- Graph showing the percentage of bipolar, monopolar, and multipolar cells at the ventricular surface of E14.5 cortices. WT n = 201 cells, N = 3 embryos; Cep63T/T n = 312 cells, N = 3 embryos; Sas4cKO n = 296 cells, N = 3 embryos; #, chi‐square test with *, post hoc analysis, comparisons are made to WT.
- E14.5 cortices stained with antibodies against Ki67 (red) and phosphorylated‐Histone H3 (PH3, yellow). Insets showing zoomed in view of cells in the ventricular zone (VZ) and sub‐ventricular zone (SVZ). Scale bar = 100 μm.
- Ratio of mitotic (PH3+) to cycling (Ki67+) cells in E14.5 cortices. WT N = 5, Cep63T/T N = 3, Sas4cKO N = 3; two‐tailed Mann–Whitney t‐test.
- Protocol for the establishment of primary NPC cultures for live imaging.
- Representative images from live‐cell movies of Nuclear‐mCherry+ WT, Cep63T/T, and Sas4cKO NPCs. The timing of mitosis began at nuclear envelope breakdown (NEBD) and finished at nuclear envelope reformation. White arrows track the mitotic events of the mother cell from NEBD to the generation of daughter cells following cytokinesis.
- Plot showing the duration of mitosis in WT, Cep63T/T, and Sas4cKO NPCs. Triangles represent individual cells; triangles of the same color represent cells derived from the same embryo. Circles represent the average mitotic duration of cells from each embryo. WT n = 202 cells, N = 4 embryos; Cep63T/T n = 141 cells, N = 3 embryos; Sas4cKO n = 138 cells, N = 3 embryos; two‐tailed Welch’s t‐test.
Data information: All data represent the means ± SEM. *P < 0.05; **< 0.01; ***< 0.001; ****< 0.0001 and not significant indicates P > 0.05. See also Fig EV1.
