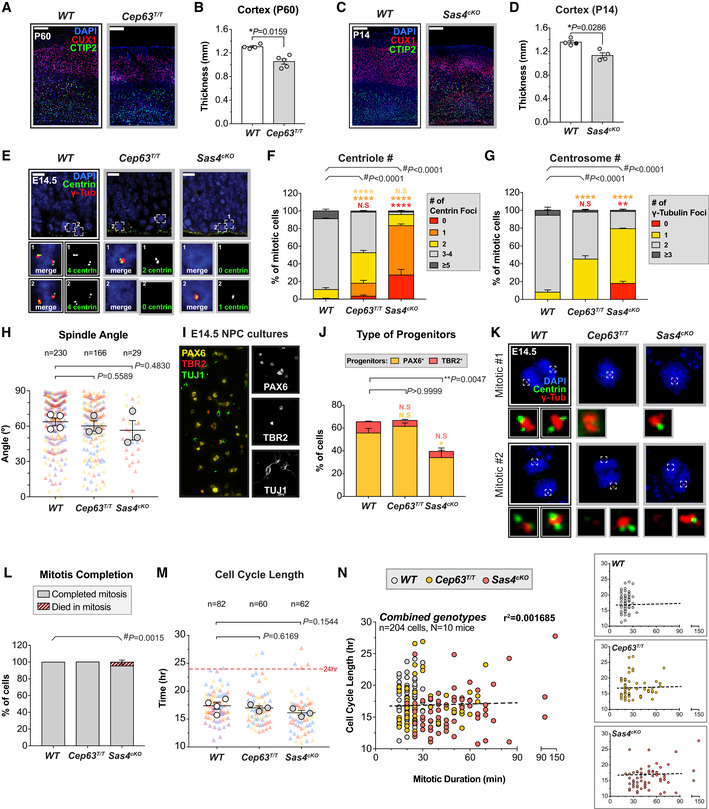
Figure EV1. Depletion of SAS4 or CEP63 leads to centrosome loss and reduced cortical size in adult mice. Related to Fig 1 .

-
AWT and Cep63T/T cortices at P60 stained with antibodies against the deep layer marker CTIP2 (green), superficial layer marker CUX1 (red) and DAPI (blue). Scale bar = 200 μm.
-
BCortical thickness of P60 brains of the indicated genotypes. WT littermates N = 4, Cep63T/T N = 5; two‐tailed Mann–Whitney test.
-
CWT and Sas4cKO cortices at P14 stained with antibodies against the deep layer marker CTIP2 (green), superficial layer marker CUX1 (red) and DAPI (blue). Scale bar = 200 μm.
-
DCortical thickness of P14 brains of the indicated genotypes. WT littermates N = 4, Sas4cKO N = 4; two‐tailed Mann–Whitney test.
-
EWT, Cep63T/T and Sas4cKO cortices at E14.5 stained with antibodies against centrin (green), γ‐tubulin (red) and DAPI (blue). Insets showing zoomed in view of 2 representative cells. Scale bar = 25 μm.
-
F, GQuantification of the number of (F) centrin foci and (G) γ‐tubulin foci in mitotic cells in the VZ of E14.5 cortices. WT n = 175 cells, N = 4 embryos; Cep63T/T n = 150 cells, N = 3 embryos; Sas4cKO n = 150 cells, N = 3 embryos; #, chi‐square test with *, post hoc analysis, comparisons are made to WT.
-
HPlot showing the spindle angle of dividing NPCs relative to the ventricular surface in WT, Cep63T/T and Sas4cKO at E14.5. Triangles represent individual cells; triangles of the same color represent cells derived from the same embryo. Circles represent the average spindle angle of mitotic cells from each embryo. WT n = 230 cells, N = 4 embryos; Cep63T/T n = 166 cells, N = 3 embryos; Sas4cKO n = 29 cells, N = 3 embryos; two‐tailed Welch’s t‐test. Note that the frequency of bipolar spindle formation is lower in Cep63T/T and Sas4cKO brains.
-
IRepresentative image from a disassociated NPC culture derived from an E14.5 WT brain stained with antibodies against the radial glial cell marker PAX6 (yellow), intermediate progenitor marker TBR2 (red) and differentiated neuron marker TUJ1 (green).
-
JGraph showing the percentage of radial glial cells (PAX6+, yellow) and intermediate progenitor cells (TBR2+, red) present in NPC cultures derived from E14.5 brains of the indicated genotypes. WT N = 6, Cep63T/T N = 3, Sas4cKO N = 5; multiple t‐tests, comparisons are made to WT.
-
KRepresentative images of mitotic cells in disassociated NPC cultures derived from E14.5 WT, Cep63T/ T and Sas4cKO brains stained with antibodies against centrin (green), γ‐tubulin (red) and DAPI (blue). Insets showing zoomed in view of the spindle poles.
-
LGraph showing the fate of mitotic NPCs of the indicated genotypes. WT n = 165 cells, N = 4 embryos; Cep63T/T n = 130 cells, N = 3 embryos; Sas4cKO n = 117 cells, N = 3 embryos. #, chi‐square test.
-
MGraph showing the total cell cycle length in WT, Cep63T/T, and Sas4cKO NPCs. The timing of the cell cycle began at NEBD of the mother cell and finished at NEBD in one of the two daughter cells. Triangles represent individual cells; triangles of the same color represent cells derived from the same embryo. Circles represent the average cell cycle length of cells from each embryo. Dashed line is set at 24 h. WT n = 82 cells, N = 4 embryos; Cep63T/T n = 60 cells, N = 3 embryos; Sas4cKO n = 62 cells, N = 3 embryos; two‐tailed Welch’s t‐test.
-
NGraphs showing cell cycle length as a function of mitotic duration in individual NPCs dissociated from WT (gray), Cep63T/T (yellow), and Sas4cKO (red) brains. The dashed line represents the best‐fit linear regression function (r 2 = 0.0017) for all genotypes combined.
Data information: All data represent the means ± SEM. *P < 0.05; **< 0.01; ****< 0.0001 and not significant indicates P > 0.05.
