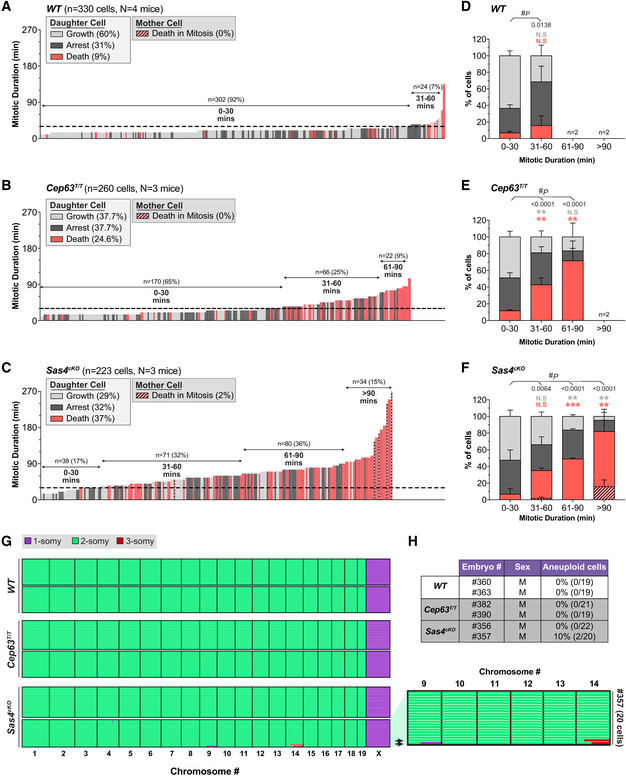
Figure 2. Prolonged mitosis leads to an increased frequency of cell death in the progeny of NPCs.

-
A–CGraph showing the mitotic duration of NPCs and the fate of their progeny in primary cultures generated from E14.5 embryos. Each bar represents one cell; its height represents the amount of time the mother cell spent in mitosis; bar color represents the fate of the progeny. Dashed line is set at 30 mins. WT n = 330 cells, N = 4 embryos; Cep63T/T n = 260 cells, N = 3 embryos; Sas4cKO n = 223 cells, N = 3 embryos.
-
D–FPercentage of proliferating, arrested and apoptotic progeny within each group of the indicated mitotic duration, calculated from data shown in (A–C); groups with n < 20 cells were excluded from this quantification; #, chi‐square test with *, post hoc analysis, within each genotype, comparisons are made to the 0–30 min group.
-
GGenome‐wide copy number plots of single cells sequenced from dissociated dorsolateral telencephalons of E14.5 embryos. Individual cells are represented in rows with copy number states indicated by colors; arrows on the zoomed in view (right) indicate aneuploid cells. WT n = 38 cells, N = 2 embryos; Cep63T/T n = 40 cells, N = 2 embryos; Sas4cKO n = 42 cells, N = 2 embryos.
-
HPercentage of aneuploid cells from the single‐cell sequencing data shown in (G).
Data information: All data represent the means ± SEM. *P < 0.05; **< 0.01; ***< 0.001; and not significant indicates P > 0.05. See also Fig EV2.
