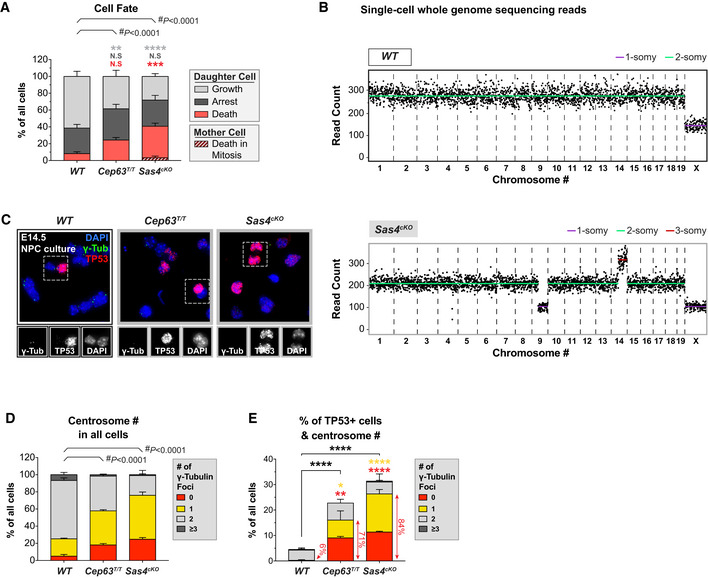
Figure EV2. Sas4cKO and Cep63T/T NPCs with centrosome loss upregulate TP53. Related to Fig 2 .

-
APercentage of proliferating, arrested and apoptotic progeny within each genotype, calculated from data shown in Fig 2A–C; #, chi‐square test with *, post hoc analysis, comparisons are made to WT.
-
BSingle‐cell whole genome sequencing data of a representative WT (top) and Sas4cKO (bottom) cell dissociated from E14.5 brains. Each black dot indicates the number of reads per 1 Mb sequence; copy number states indicated by colored lines.
-
CRepresentative images of NPCs dissociated from E14.5 WT, Cep63T/T, and Sas4cKO brains stained with antibodies against γ‐tubulin (green), TP53 (red), and DAPI (blue). Insets showing zoomed in view of TP53‐positive cells.
-
D, EQuantification of the number of γ‐tubulin foci in interphase NPCs dissociated from E14.5 cortices. Graphs show centrosome number in all cells (D) or TP53‐positive cells (E). Red arrowheads highlight the fraction of cells with centrosome loss among all TP53‐positive cells. WT n = 399 cells, N = 4 embryos; Cep63T/T n = 299 cells, N = 3 embryos; Sas4cKO n = 300 cells, N = 3 embryos; #, chi‐square test and *, multiple t‐tests, comparisons are made to WT.
Data information: All data represent the means ± SEM. *P < 0.05; **< 0.01; ***< 0.001; ****< 0.0001 and not significant indicates P > 0.05.
