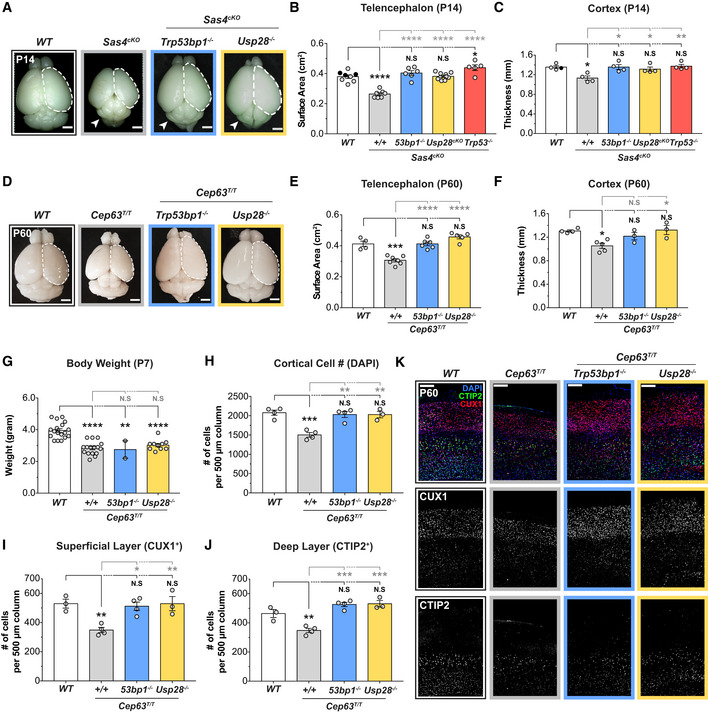
Figure 3. Centrosome defects reduce brain size through activation of the mitotic surveillance pathway.

-
ARepresentative whole mount images of WT, Sas4cKO, Sas4cKO;Trp53bp1 −/−, Sas4cKO;Usp28cKO animals at P14. Arrows indicate the cerebellar hypoplasia resulting from the lack of primary cilia. Scale bar = 0.2 cm.
-
BTelencephalon area of P14 brains of the indicated genotypes. WT littermates N = 8, Sas4cKO N = 7, Sas4cKO;Trp53bp1 −/− N = 6, Sas4cKO;Usp28cKO N = 10, Sas4cKO;Trp53 −/− N = 5; one‐way ANOVA with post hoc analysis. WT and Sas4cKO data are from Fig 1D and shown alongside for comparison. Black circles represent Nestin‐Cre+ animals.
-
CCortical thickness of P14 brains of the indicated genotypes. WT littermates N = 4, Sas4cKO N = 4, Sas4cKO;Trp53bp1 −/− N = 4, Sas4cKO;Usp28cKO N = 4, Sas4cKO;Trp53 −/− N = 4; one‐way ANOVA with post hoc analysis. WT and Sas4cKO data are from Fig EV1D and shown alongside for comparison. Black circles represent Nestin‐Cre+ animals.
-
DRepresentative whole mount images of WT, Cep63T/T, Cep63T/T;Trp53bp1 −/−, Cep63T/T;Usp28 −/− animals at P60. Scale bar = 0.2 cm.
-
ETelencephalon area of P60 brains of the indicated genotypes. WT littermates N = 4, Cep63T/T N = 7, Cep63T/T;Trp53bp1 −/− N = 6, Cep63T/T;Usp28 −/− N = 5; one‐way ANOVA with post hoc analysis. WT and Cep63T/T data are from Fig 1B and shown alongside for comparison.
-
FCortical thickness of P60 brains of the indicated genotypes. WT littermates N = 4, Cep63T/T N = 5, Cep63T/T;Trp53bp1 −/− N = 3, Cep63T/T;Usp28 −/− N = 3; one‐way ANOVA with post hoc analysis. WT and Cep63T/T data are from Fig EV1B and shown alongside for comparison.
-
GBody weight of P7 animals of the indicated genotypes. WT littermates N = 18, Cep63T/T N = 16, Cep63T/T;Trp53bp1 −/− N = 2, Cep63T/T;Usp28 −/− N = 10; one‐way ANOVA with post hoc analysis.
-
HQuantification of total number of cells within a 500 μm‐width column of cortices at P60. WT littermates N = 4, Cep63T/T N = 4, Cep63T/T;Trp53bp1 −/− N = 4, Cep63T/T;Usp28 −/− N = 3; one‐way ANOVA with post hoc analysis.
-
I, JQuantification of the number of cells in the (I) superficial layer (CUX1+) and (J) deep layer (CTIP2+) within a 500 μm‐width column of P60 cortices. WT littermates N = 3, Cep63T/T N = 4, Cep63T/T;Trp53bp1 −/− N = 4, Cep63T/T;Usp28 −/− N = 3; one‐way ANOVA with post hoc analysis.
-
KP60 cortices of indicated genotypes stained with antibodies against the deep layer marker CTIP2 (green), superficial layer marker CUX1 (red) and DAPI (blue). Scale bar = 200 μm.
Data information: All data represent the means ± SEM. *P < 0.05; **< 0.01; ***< 0.001; ****< 0.0001 and not significant indicates P > 0.05. See also Fig EV3.
