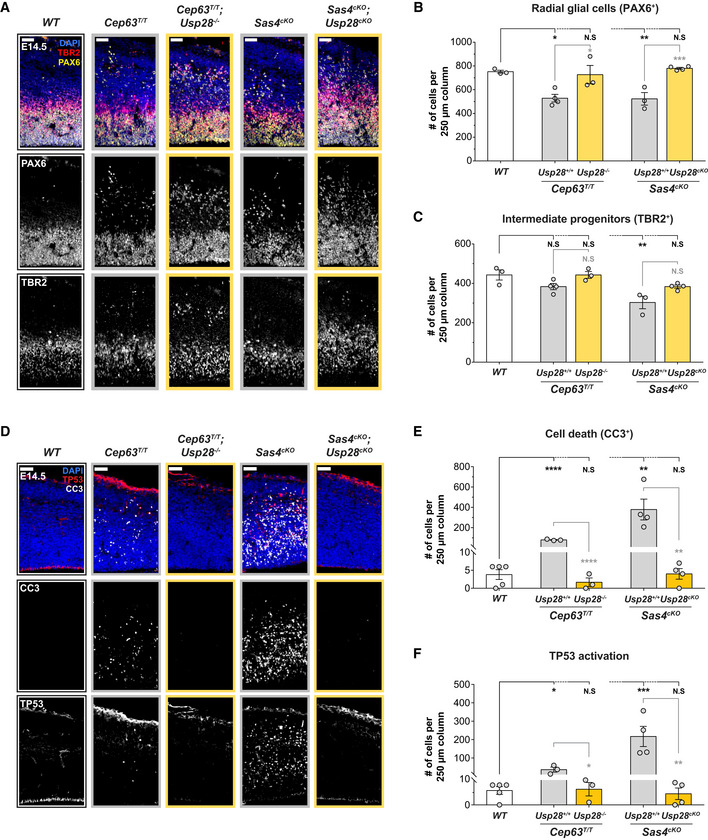
Figure 4. Inactivation of the mitotic surveillance pathway prevents NPCs depletion in brains with centrosome defects.

-
ACortices from E14.5 brains stained with antibodies against the radial glial cell marker PAX6 (yellow), intermediate progenitor marker TBR2 (red) and DAPI (blue). Scale bar = 50 μm.
-
B, CQuantification of the number of (B) radial glial cells (PAX6+) and (C) intermediate progenitors (TBR2+) within a 250 μm‐width column of E14.5 cortices. WT N = 3, Cep63T/T N = 4, Cep63T/T;Usp28 −/− N = 3, Sas4cKO N = 3, Sas4cKO;Usp28cKO N = 4; one‐way ANOVA with post hoc analysis.
-
DCortices from E14.5 embryos stained with antibodies against cleaved‐caspase 3 (CC3, white), TP53 (red) and DAPI. Scale bar = 50 μm.
-
E, FQuantification of the number of CC3+ apoptotic cells (E) and cells with TP53 activation (F) within a 250 μm‐width column of E14.5 cortices. WT N = 5, Cep63T/T N = 3, Cep63T/T;Usp28 −/− N = 3, Sas4cKO N = 4, Sas4cKO;Usp28cKO N = 4; one‐way ANOVA with post hoc analysis.
Data information: All data represent the means ± SEM. *P < 0.05; **< 0.01; ***< 0.001; ****< 0.0001 and not significant indicates P > 0.05. See also Fig EV4.
