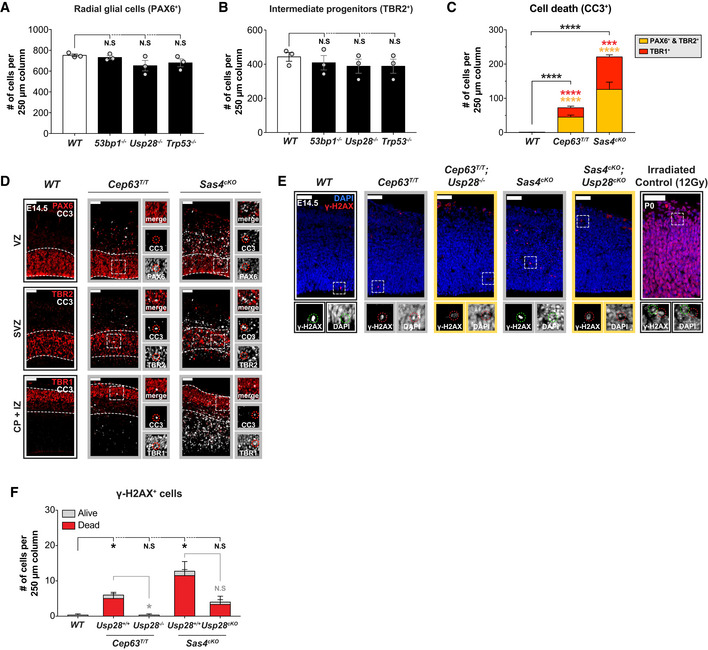
Figure EV4. Sas4cKO and Cep63T/T brains show elevated cell death in NPCs and neurons without increased DNA damage. Related to Fig 4 .

-
A, BQuantification of the number of (A) radial glial cells (PAX6+) and (B) intermediate progenitors (TBR2+) within a 250 μm‐width column of E14.5 cortices. WT N = 3, Trp53bp1 −/− N = 3, Usp28 −/− N = 3, Trp53 −/− N = 3; one‐way ANOVA with post hoc analysis.
-
CQuantification of the number of apoptotic cells (CC3+) co‐stained with PAX6‐TBR2 or TBR1 within a 250 μm‐width column of E14.5 cortices. WT N = 3, Cep63T/T N = 2, Sas4cKO N = 3; multiple t‐tests, comparisons are made to WT.
-
DCortices from E14.5 embryos stained with antibodies against cleaved‐caspase 3 and markers for radial glial cells (PAX6, red), intermediate progenitors (TBR2, red), and neurons (TBR1, red). Insets showing zoomed in view of the cortical plate (CP), the intermediate zone (IZ), the sub‐ventricular zone (SVZ), and the ventricular zone (VZ), demarcated by the white dashed lines. Scale bar = 50 μm.
-
EE14.5 cortices of indicated genotypes stained with antibodies against γ‐H2AX (red) and DAPI (blue). A P0 brain section from an irradiated animal is shown alongside as a positive control for DNA damage signal. Insets showing zoomed in view of representative γ‐H2AX+ cells. Red dashed circles indicate dead cells; green dashed circles indicate live cells. Scale bar = 50 μm.
-
FQuantification of the number of cells stained positive for γ‐H2AX within a 250 μm‐width column of E14.5 cortices; cells are categorized as dead or alive based on DAPI morphology. WT N = 3, Cep63T/T N = 4, Cep63T/T;Usp28 −/− N = 3, Sas4cKO N = 4, Sas4cKO;Usp28cKO N = 3; multiple t‐tests.
Data information: All data represent the means ± SEM. *P < 0.05; ***< 0.001; ****< 0.0001 and not significant indicates P > 0.05.
