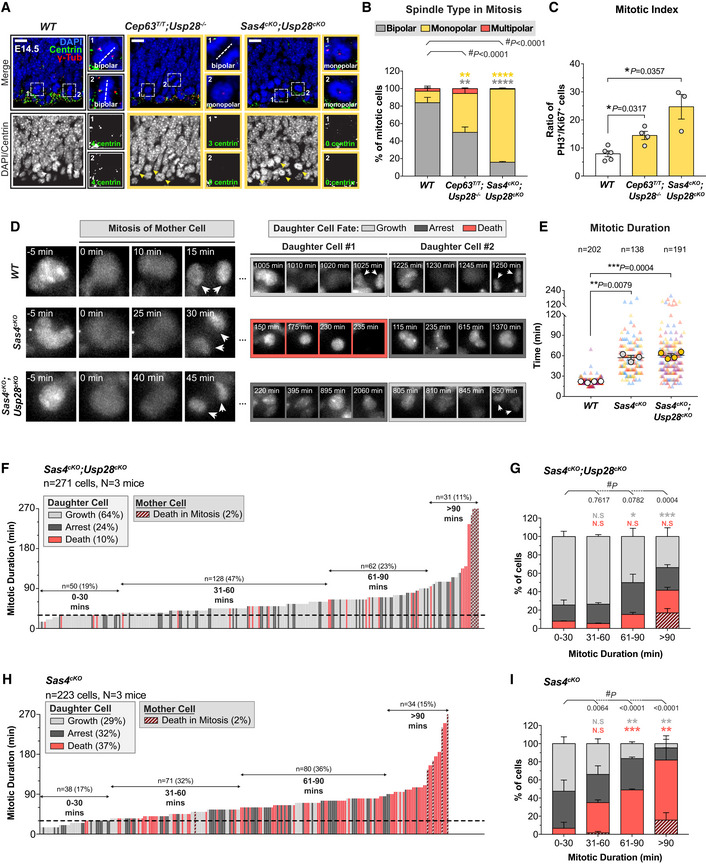
Figure 5. Inactivation of the mitotic surveillance pathway rescues NPC proliferation without alleviating the centrosome defects or mitotic delay.

-
ARepresentative images of E14.5 cortices stained with antibodies against centrin (green), γ‐tubulin (red) and DAPI (blue). White and yellow arrows indicate cells with bipolar and monopolar spindles, respectively. Insets showing zoomed in view of 2 representative cells. Dashed lines showing the orientation of the cleavage plane relative to the ventricular surface. Scale bar = 10 μm.
-
BPercentage of bipolar, monopolar and multipolar cells at the ventricular surface of E14.5 cortices. WT n = 201 cells, N = 3 embryos; Cep63T/T;Usp28 −/− n = 205 cells, N = 3 embryos; Sas4cKO;Usp28cKO n = 308 cells, N = 3 embryos; #, chi‐square test with *, post hoc analysis, comparisons are made to WT. WT data are from Fig 1F and shown alongside for comparison.
-
CRatio of mitotic (PH3+) to cycling (Ki67+) cells in E14.5 cortices. WT N = 5, Cep63T/T;Usp28 −/− N = 4, Sas4cKO;Usp28cKO N = 3; two‐tailed Mann–Whitney t‐test. 3 WT data points are from Fig 1H and shown alongside for comparison.
-
DRepresentative images from live‐cell movies of Nuclear‐mCherry+ WT, Sas4cKO, and Sas4cKO;Usp28cKO NPCs. White arrows showing the nuclei of daughter cells following cytokinesis.
-
EPlot showing quantification of mitotic duration of WT, Sas4cKO, and Sas4cKO;Usp28cKO NPCs. Triangles represent individual cells; triangles of the same color represent cells derived from the same embryo. Circles represent the average mitotic duration of cells from each embryo. WT n = 202 cells, N = 4 embryos; Sas4cKO n = 138 cells, N = 3 embryos; Sas4cKO;Usp28cKO n = 191 cells, N = 4 embryos; two‐tailed Welch’s t‐test. WT and Sas4cKO data are from Fig 1K and shown alongside for comparison.
-
FGraph showing the mitotic duration of NPCs and the fate of their progeny in primary cultures generated from Sas4cKO;Usp28cKO E14.5 embryos. Each bar represents one cell; its height represents the amount of time the mother cell spent in mitosis; bar color represents the fate of the progeny. Dashed line is set at 30 min. Sas4cKO;Usp28cKO n = 271 cells, N = 3 embryos.
-
GPercentage of proliferating, arrested, and apoptotic progeny within each group of the indicated mitotic duration, calculated from data shown in (F); #, chi‐square test with *, post hoc analysis, comparisons are made to the 0–30 min group.
-
H, IData from Fig 2C and F shown alongside for comparison with (F and G).
Data information: All data represent the means ± SEM. *P < 0.05; **< 0.01; ***< 0.001; ****< 0.0001 and not significant indicates P > 0.05. See also Fig EV5.
