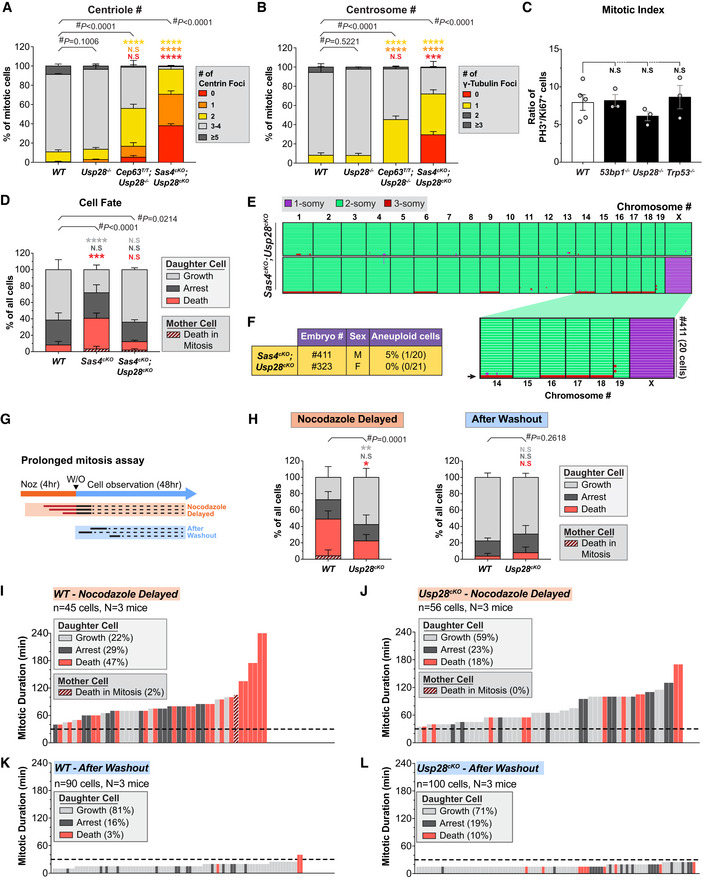
Figure EV5. Prolonging mitosis results in USP28‐dependent cell death in the progeny of NPC divisions. Related to Fig 5 .

-
A, BQuantification of the number of (A) centrin foci and (B) γ‐tubulin foci in mitotic cells in the VZ of E14.5 cortices. WT n = 175 cells, N = 4 embryos; Usp28 −/− n = 137 cells, N = 3 embryos; Cep63T/T;Usp28 −/− n = 150 cells, N = 3 embryos; Sas4cKO;Usp28cKO n = 150 cells, N = 3 embryos. #, chi‐square test, with * post hoc analysis, comparisons are made to WT. WT data are from Fig EV1F and G and shown alongside for comparison.
-
CRatio of mitotic (PH3+) to cycling (Ki67+) cells in E14.5 cortices. WT N = 5, Trp53bp1 −/− N = 3, Usp28 −/− N = 3, Trp53 −/− N = 3; one‐way ANOVA with post hoc analysis. WT data are from Fig 1H and shown alongside for comparison.
- D
-
EGenome‐wide copy number plots of single cells sequenced from NPCs dissociated from Sas4cKO;Usp28cKO E14.5 brains. Individual cells are represented in rows with copy number states indicated by colors; arrow on the zoomed in view (bottom) indicates an aneuploid cell. Sas4cKO;Usp28cKO n = 41 cells, N = 2 embryos.
-
FPercentage of aneuploid cells from the single‐cell sequencing data shown in E.
-
GSchematic of the prolonged mitosis assay.
-
HPercentage of proliferating, arrested and apoptotic progeny in WT and Usp28cKO dissociated NPCs with delayed mitosis (nocodazole delayed; WT n = 45 cells, N = 3 embryos; Usp28cKO n = 56 cells, N = 3 embryos) and normal mitosis (After Washout; WT n = 90 cells, N = 3 embryos; Usp28cKO n = 100 cells, N = 3 embryos) calculated from data shown in Fig EV5I–L; #, chi‐square test with *, post hoc analysis, comparisons are made to WT.
-
I, JGraph showing the mitotic duration and fate of (I) WT and (J) Usp28cKO E14.5 NPCs that were delayed in mitosis using nocodazole (0.08 μM). Each bar represents one cell; its height represents the amount of time the mother cell spent in mitosis; bar color represents the fate of the progeny. WT n = 45 cells, N = 3 embryos; Usp28cKO n = 56 cells, N = 3 embryos.
-
K, LGraph showing the mitotic duration and fate of (K) WT and (L) Usp28cKO NPCs from the same experiment in I and J that entered mitosis after nocodazole washout. WT n = 90 cells, N = 3 embryos; Usp28cKO n = 100 cells, N = 3 embryos.
Data information: All data represent the means ± SEM. *P < 0.05; **< 0.01; ***< 0.001; **** < 0.0001 and not significant indicates P > 0.05.
