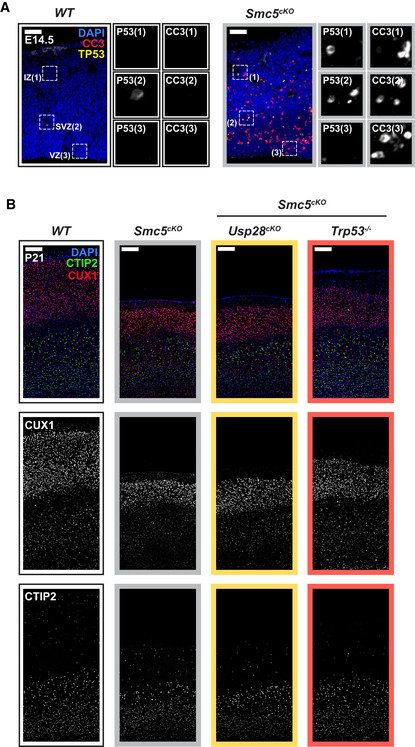
Figure EV6. Smc5cKO embryonic brains show TP53 upregulation. Related to Fig 6 .

- Cortices from E14.5 embryos stained with antibodies against cleaved‐caspase 3 (CC3, red), TP53 (yellow), and DAPI (blue). Insets showing zoomed in view of the intermediate zone (IZ), the sub‐ventricular zone (SVZ), and ventricular zone (VZ). Scale bar = 50 μm.
- P21 cortices of the indicated genotypes stained with antibodies against the deep layer marker CTIP2 (green), superficial layer marker CUX1 (red) and DAPI (blue). Scale bar = 200 μm.
