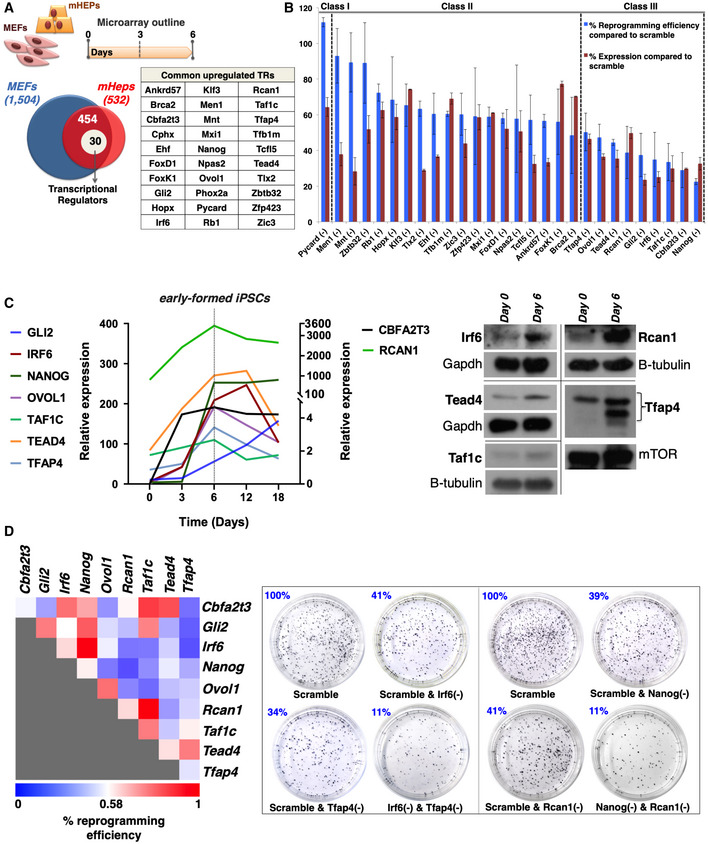
Figure 1. Identification of nine TRs required for the generation of iPSCs from cells of different origins.

- Venn diagram depicting the total number of genes upregulated in MEFs (1504) or mHEPs (532) undergoing reprogramming and the 454 common genes upregulated in both MEFs and mHeps at day 6 of reprogramming. Of these, 30 genes, listed in the adjacent table, encode for transcriptional regulators (TRs). The top diagram indicates the experimental outline of the DNA microarrays expression studies performed in MEFs and mHEPs undergoing reprogramming.
- Bar graph summarizing the efficiency of single RNAi knockdowns for 28 out of the 30 TRs, and their effects in the reprogramming efficiency in comparison to control cells expressing scramble shRNA. The efficiency of each TR's knockdown (KD) does not correlate with its effect in reprogramming efficiency. The knockdown of 9 (class III) out of the 28 TRs decreased the efficiency of the reprogramming in a statistically significant manner (unpaired two‐tailed Student's t‐test, P‐value < 0.05). Data are shown as mean ± SEM of at least two independent experiments. Class I corresponds to one TR inhibiting reprogramming, whereas class II corresponds to 18 TRs having a weak or no effect in reprogramming. Shown are the effects of 28 out of 30 TRs, because we did not succeed in knocking down Cphx and Phox2a.
- Left: Shown is a line graph depicting normalized mRNA expression levels of the nine TRs at the indicated time points during the reprogramming of MEFs. The data were plotted after normalization with the endogenous Gapdh using the “ΔCt method”. The gray vertical dashed line depicts day 6 in which the expression levels of nearly all TR peaks. Notice that the y‐axis is broken to accommodate the large spread of expression levels. Right: Shown are Western blots using antibodies specific for Irf6, Tead4, Taf1c, Rcan1, and Tfap4. Whole‐cell extracts were prepared from MEFs at day 6 of reprogramming and run side‐by‐side with extracts from control samples (day 0). Gapdh, mTOR, and b‐tubulin were used as loading controls.
- Same as in (B) except MEFs were co‐transduced with lentiviruses expressing all possible pairwise combinations of shRNAs for the nine TRs. Left: Heat map depicting the effects of paired KD combinations in the reprogramming efficiency (RE%). Shown are the average RE values from at least two independent experiments. The REs of the double KDs were evaluated against the RE of the corresponding single KDs. Right: Alkaline phosphatase (AP)‐stained cultures of terminal reprogrammed MEFs upon representative single and double KDs of our shRNA‐based screens.
Source data are available online for this figure.
