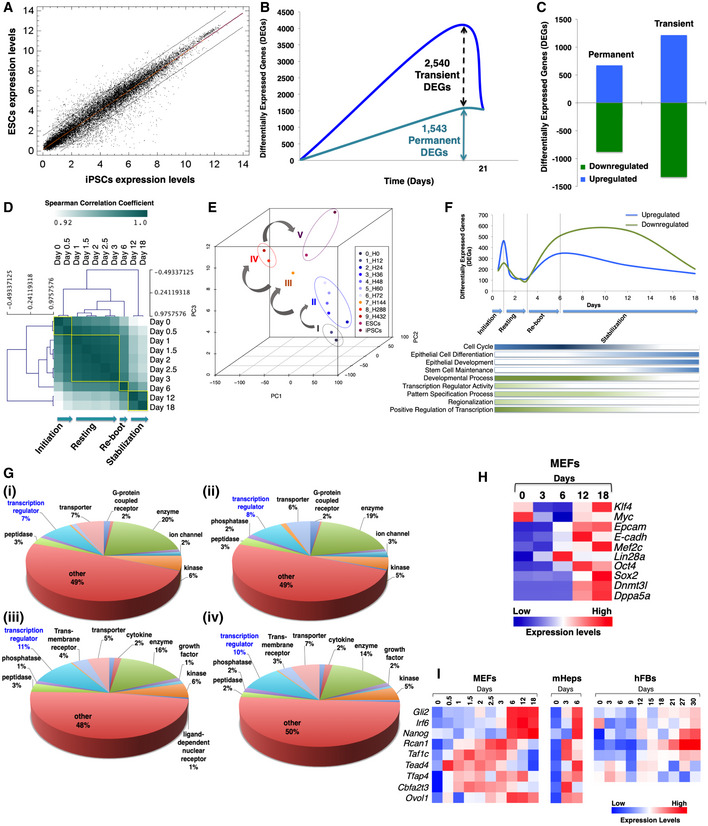
Figure EV1. Analysis of genes whose expression is altered during cellular reprogramming.

- Comparison of the transcriptomic profiles between mESCs and miPSCs. The two black diagonal lines enclose 95% of expressed genes with high correlation, that is, with similar expression profiles in both cell types. Spearman's correlation coefficient = 0.97; normalization with RMA.
- Line plot depicting the number of differentially expressed genes (DEGs), which either change their expression transiently or permanently at least once during reprogramming.
- Bar graph showing the number of up‐ and downregulated DEGs, transiently or permanently, during reprogramming.
- Hierarchical clustering of the gene expression profiles of MEFs undergoing reprogramming from day 0 to day 18. Clustering revealed four distinct phases, of which day 6 is characterized by Nanog activation.
- PCA of the gene expression profiles described in (D).
- Line plot depicting the number of upregulated (blue line) and downregulated DEGs (green line) during MEF reprogramming. The bars shown below the line plot represent the enrichment of selected gene ontology categories at each time point.
- Gene Ontology (GO) analysis categorization of up‐ and downregulated DEGs until day 6 of reprogramming (i, iii for MEFs and ii, iv for mHEPs). Transcriptional regulators are highlighted in blue color.
- Heat map depicting the pattern of expression of well‐characterized mesenchymal, epithelial, and pluripotent markers during MEF reprogramming (data derived from qPCR assays).
- Heat map showing the expression pattern of the nine TRs at selected time points during reprogramming of MEFs, mHeps (data derived from DNA microarray assay), and hFBs (data derived from qPCR assays).
Source data are available online for this figure.
