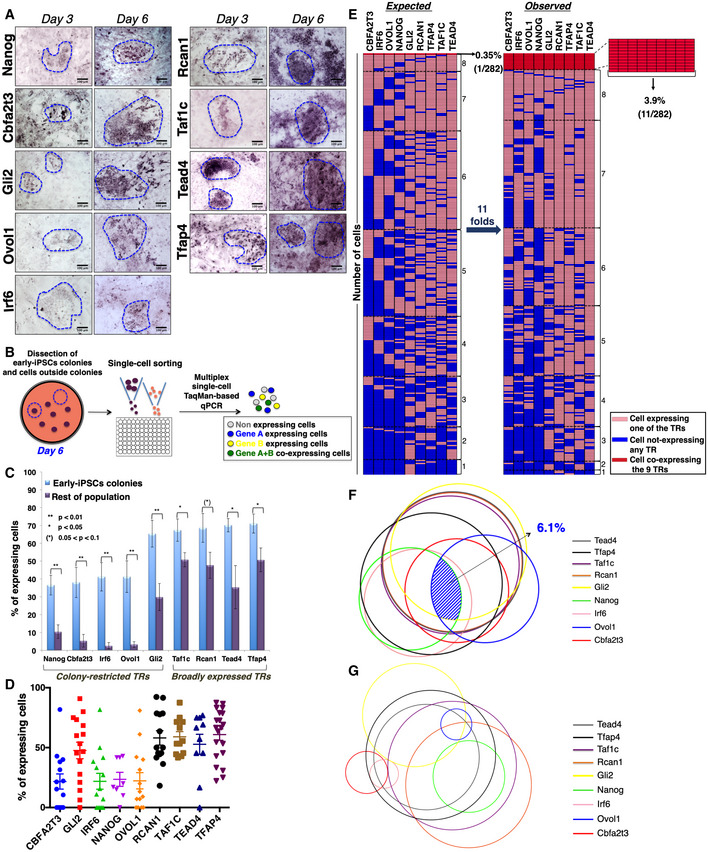
Figure 2. Stochastic expression of the nine TRs in MEFs undergoing reprogramming.

- RNA in situ hybridization depicting the expression patterns of the nine TRs in days 3 and 6 of MEF reprogramming. The boundaries of the early‐iPSC formations are indicated by a blue dashed line. Scale bars: 100 μm.
- Illustration of the experimental setup for the single‐cell TaqMan‐based qPCR assay.
- Bar graph showing the percentage of cells isolated from early‐iPSC colonies or outside of the colonies (rest of population) expressing each of the nine TRs. Data are shown as mean ± SEM of at least two independent experiments. 0.05 < (*)P < 0.1, *P < 0.05, **P < 0.01 by unpaired Student's t‐test or Welch's t‐test, when appropriate.
- Scatter plot depicting a visual unbiased representation of the percentile of cells expressing each of the nine TRs. Each dot depicts the percentage of cells expressing the indicated TRs in individual experiments. Data are shown as mean ± SEM of at least two independent experiments. ANOVA test P < 0.0001.
- Schematic representation of the statistical analysis estimating the probability of co‐expression of the nine TRs per cell within the early‐iPSC colonies. Each row consists of 9 tiles representing a single cell, and each column shows the expression status of each of the nine TRs (shown with different colors) in 282 cells (right side legend). The co‐expression of gradually increasing numbers of TRs is grouped from the bottom to the top of the figure. The left part has been generated by estimating the percentages of expression of any single TR per cell as derived from single gene expression in single cells, while the right part depicts the co‐expression of combinations of the nine TRs based on double and triple single‐cell experiments.
- Venn diagram model depicting the co‐expression of the nine TRs in cells lying within the early‐iPSC colonies on day 6 of reprogramming. The area of each circle represents the percentage of cells expressing each TR, as determined from the single single‐cell experiments, and the overlapping areas between circles represent the percentage of co‐expression of two or three TRs, as revealed from our double and triple TR single‐cell RNA expression experiments. The shaded blue area highlights the percentage of cells co‐expressing all the nine TRs.
- Same as of (F) except depicting the co‐expression of the nine TRs in cells lying outside the early‐iPSC colonies.
Source data are available online for this figure.
