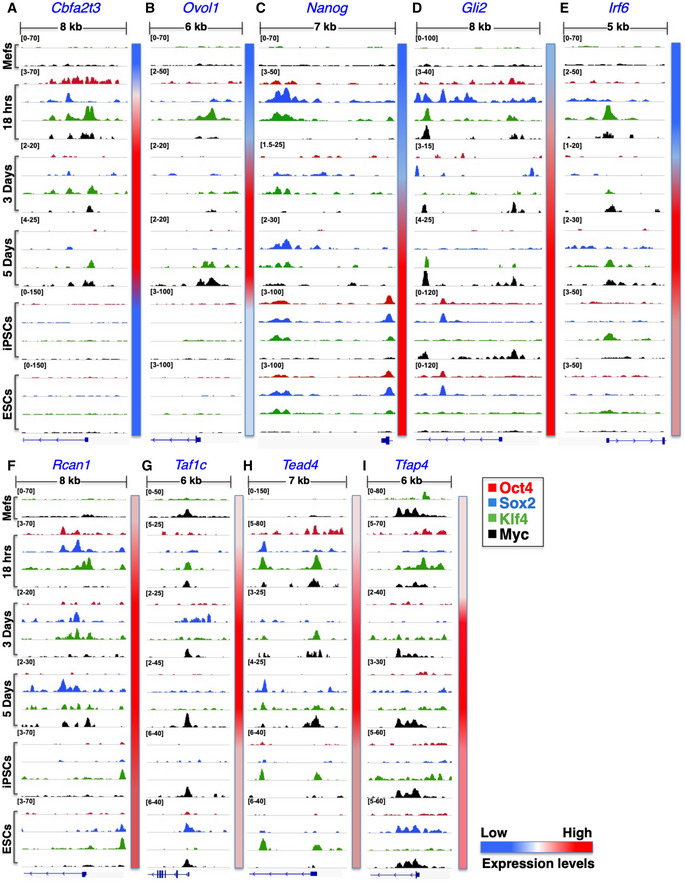
Figure 3. The expression of the nine TRs is regulated by direct binding of the OSKM reprogramming factors to putative regulatory regions.

-
A–IShown are ChIP‐seq big wig files in the IGV browser depicting the binding of Oct4 (red), Sox2 (blue), Klf4 (green), and c‐Myc (black) to putative regulatory regions in the nine TR genes in MEFs undergoing reprogramming (18 h, D3, and D5) and in control MEFs, mESCs, and miPSCs. All peaks have been normalized against input DNA. The relative sizes of the represented genomic loci and the corresponding TSSs are also indicated. The side color bar depicts the expression levels of each TR at the indicated time points.
