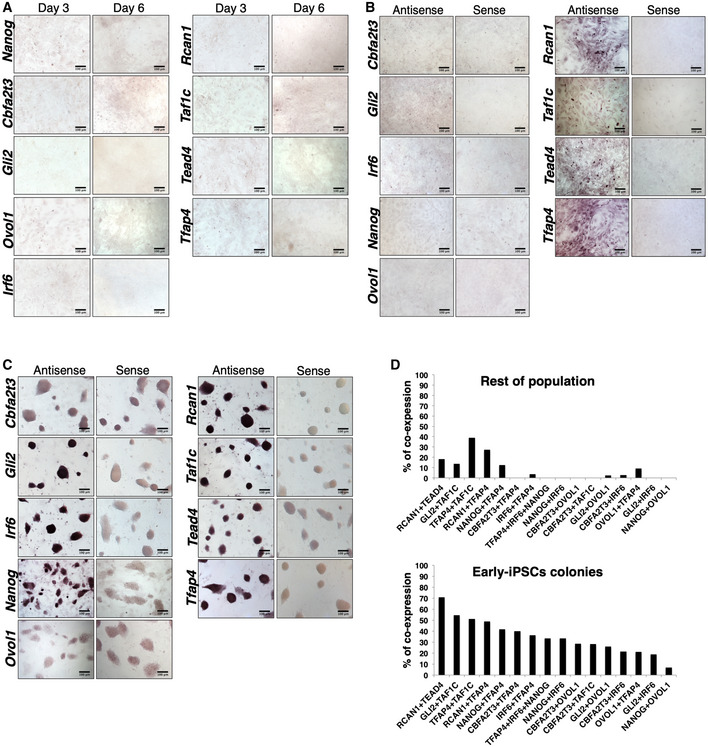
Figure EV3. The spatiotemporal (co)‐expression pattern of nine TRs.

- RNA in situ hybridization (ISH) experiments in MEFs undergoing reprogramming (day 3 and day 6), depicting the hybridization pattern using the sense RNA strand of each of the nine TRs as probes. Scale bars, 100 μm.
- RNA in situ hybridization experiments using naïve MEFs hybridized with the sense or the antisense RNA strand of each of the nine TRs, as indicated at the top and at the left side of each panel, respectively. Scale bars, 100 μm.
- Same as in (B) except that mESCs were used.
- Bar graph depicting the co‐expression frequencies of the indicated combinations of nine TRs within the early‐iPSC colonies and in the rest of the population of MEFs, based on double and triple single‐cell experiments.
Source data are available online for this figure.
