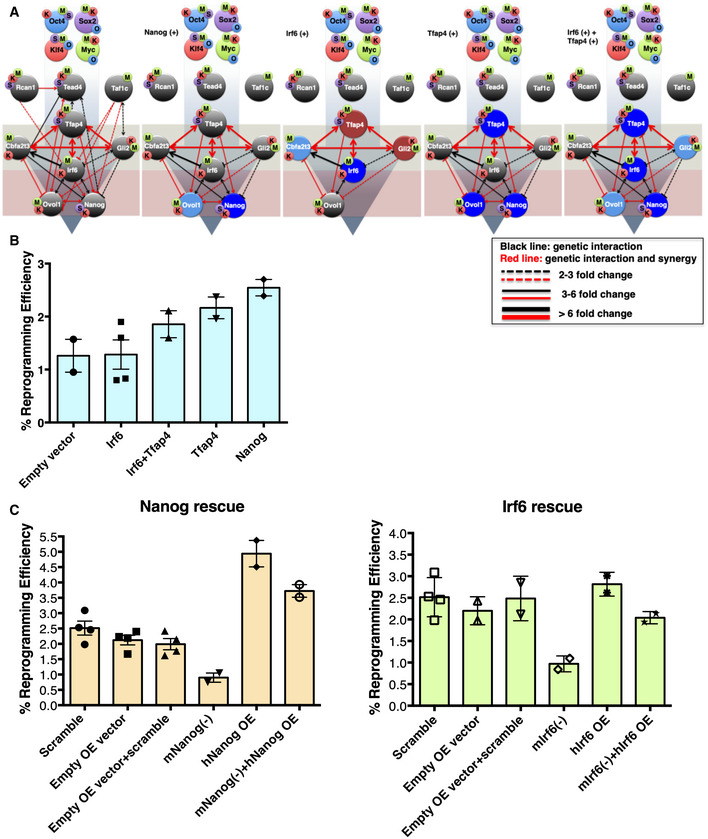
Figure 5. Validation of the 9TR GRN.

- The effect of overexpression of the indicated TRs (Nanog, Irf6, Tfap4, and Irf6 + Tfap4) on the expression of the other TRs of the network was determined by RT–qPCR analyses. Dark blue color denotes TRs upregulated more than twofold. Reduction by more than twofold in the expression is depicted by the absence of the corresponding TR. The light red and blue colored circles indicate downregulation or upregulation in the range of 1.3 to twofold, respectively, while gray circles indicate no change in gene expression. O: Oct4, S: Sox2, K: Klf4, and M: c‐Myc. The light gray‐green and red boxes depict the upstream and downstream layers of the 9TR GRN. The first panel on the left denotes the native 9TR GRN as shown in Fig 4B (phase III).
- Shown is a bar graph depicting the effect of overexpression of the indicated TRs in reprogramming efficiency. Data are shown as mean ± SEM of at least two independent experiments. The y‐axis labeled as % reprogramming efficiency refers to the AP+ colonies scored as iPSCs.
- Shown is a bar graph depicting the effects of rescue experiments in reprogramming efficiency. MEFs undergoing reprogramming were knocked down using shRNAs for the endogenous Nanog or Irf6 expression and were co‐infected with a vector expressing an shRNA‐resistant human homologue of Nanog or Irf6 (hNanog OE, hIrf6 OE). Data are shown as mean ± SEM of two independent experiments.
Source data are available online for this figure.
