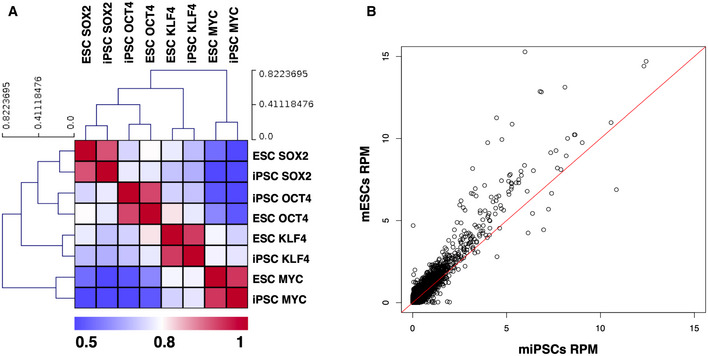
Figure EV5. Genome‐wide correlation of OSKM binding between mESCs and miPSCs.

- Shown is a heat map depicting the similarity of O/S/K/M binding between mESCs and iPSCs. All ChIP‐seq peaks were merged and the total number of reads corresponding in each peak was counted, the signal was normalized for sequencing depth (RPM—reads per million), and the Pearson's correlation coefficient was estimated for all ESC‐iPSC and O/S/K/M pairs.
- Scatter plot depicting the extensive similarity of the Sox2 genome‐wide DNA‐binding pattern between iPSCs and ESCs. The red line represents the correlation equal to 1.
