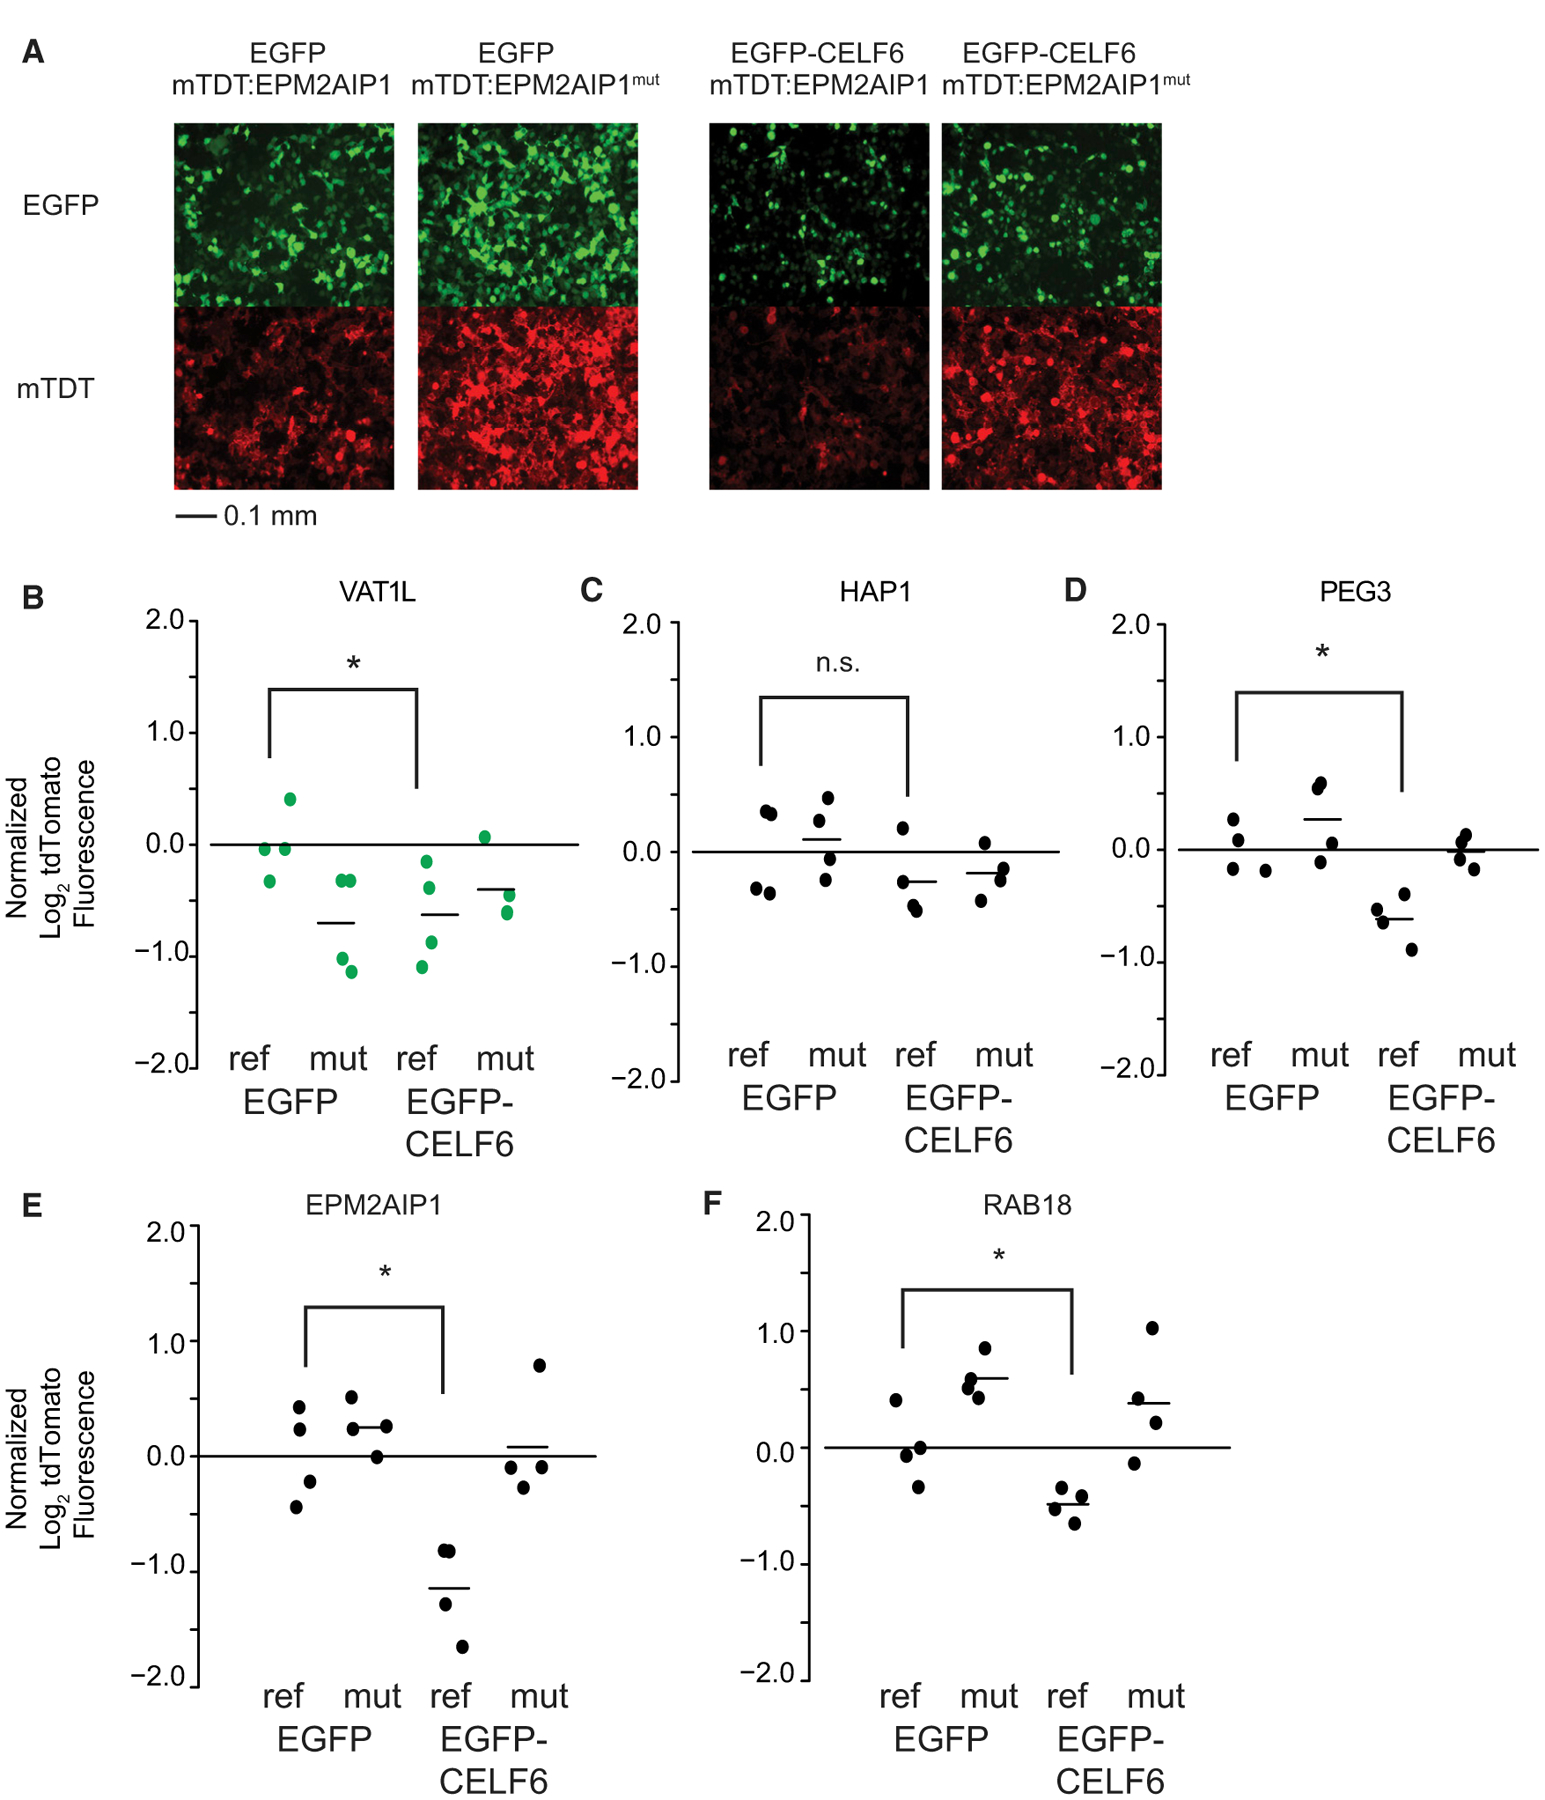
Figure 4. Individual mtdTomato UTR Element Constructs Replicate Interactions of CELF6 Expression and Sequence.

Individual UTR elements were cloned as in Figure 3A and transfected along with either EGFP or EGFP-CELF6
(A) Example of live-cell epifluorescent images from a transfection experiment showing EGFP or EGFP-CELF6 expression (top panels) and either tdTomato:EPM2AIP1 or tdTomato:EPM2AIP1(mutant) (bottom panels).
(B–F) tdTomato log2 fluorescence, with lines representing means normalized to EGFP/reference sequence.
Significance was assessed by two-way ANOVA, with post hoc pairwise comparisons using the multcomp package in R. n.s., p > 0.1; †p < 0.1, *p < 0.05, **p < 0.001. Green points represent library elements selected from less-stringent CELF6 target criteria (enrichment over HA/YFP input alone). Scale bar in (A) represents 0.1 mm as indicated.
