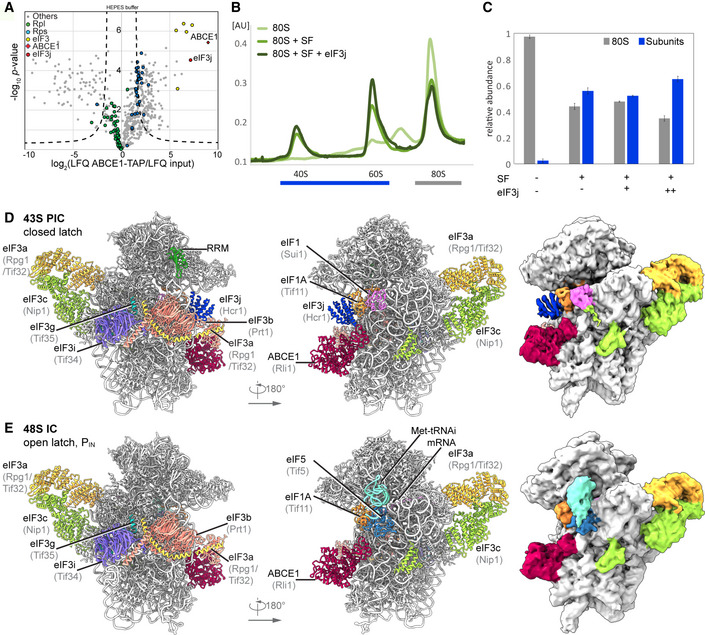
Figure 1. Biochemical analysis and cryo‐EM structures of yeast ABCE1‐containing initiation complexes.

-
AVolcano plot representing the statistical analysis of the fold enrichment of proteins after affinity purification in HEPES buffer of ABCE1‐TAP followed by label‐free quantification (LFQ) using liquid chromatography–tandem mass spectrometry (LC‐MS/MS). Proteins above the curved lines show a statistically significant enrichment according to the t‐test value.
-
B, CSucrose density gradient UV profile after in vitro splitting assays (B) and relative abundance of 80S and subunits as calculated from triplicates and displayed as mean ± SD. (C); SF = splitting factors including Dom34, Hbs1, ABCE1, and eIF6; (+) = 4‐fold molar excess of eIF3j; (++) = 20‐fold molar excess of eIF3j.
-
D, ECryo‐EM maps low‐pass filtered at 6 Å and models of the yeast subclasses representing an ABCE1‐ and eIF3j‐containing 43S PIC (D) and an ABCE1‐ and eIF5‐containing partial 48S IC (E).
Source data are available online for this figure.
