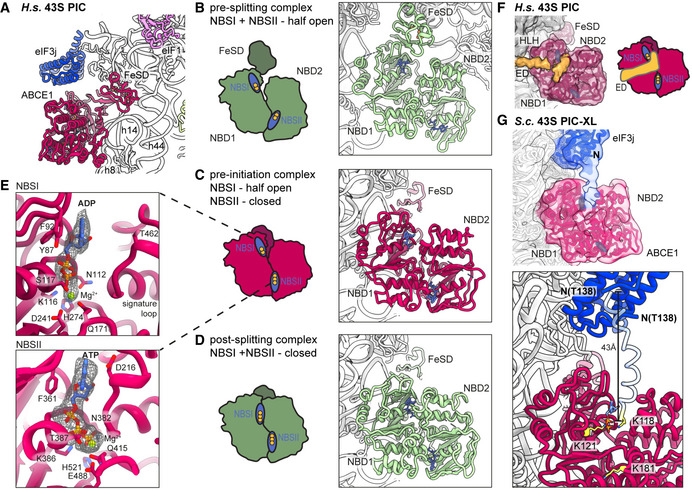
Figure 3. Conformation of ABCE1 in native 40S initiation complexes.

-
AOverall position of ABCE1 in 40S initiation complexes, here representatively shown for the human State II with eIF3j.
-
B–DSchematic representation and structure of semi‐open ABCE1 as in 80S‐pre‐splitting complexes (Brown et al, 2015, PDB 3JAH) (B), hybrid semi‐open/closed ABCE1 as in native 40S initiation complexes (C) and fully closed ABCE1 as in in vitro reconstituted post‐splitting complexes (Nürenberg‐Goloub et al, 2020, PDB 6TMF) (D). Nucleotide‐binding sites colored in blue and bound nucleotide indicated with yellow circles (one circle per phosphate group).
-
EZoom into NBSI and NBSII showing bound Mg2+‐ADP (in NBSI) and Mg2+‐ATP (in NBSII) fit in density as obtained after focused classification on ABCE1 and refinement.
-
FView focusing on the NBDs and the unassigned extra density (ED) reaching from the 40S via the HLH into NBSI. The ABCE1 map was low‐pass filtered at 6 Å. Schematic representation highlighting the position of the ED with respect to the NBSs.
-
GUpper panel: Position of eIF3j and ABCE1 in the crosslinked yeast 43S‐PIC (43S‐PIC‐XL) sample. View focusing on the ABCE1‐eIF3j interaction (same view as (F)): An extra density attributing to the eIF3j N‐terminal region is connecting the eIF3j 6‐helix bundle with NBSI of ABCE1. The map was low‐pass filtered at 8 Å. Lower panel: N‐terminally extended model of eIF3j (transparent blue) highlighting the position of K118, which was found crosslinked to K121 and K181 of ABCE1 (atoms colored in yellow).
