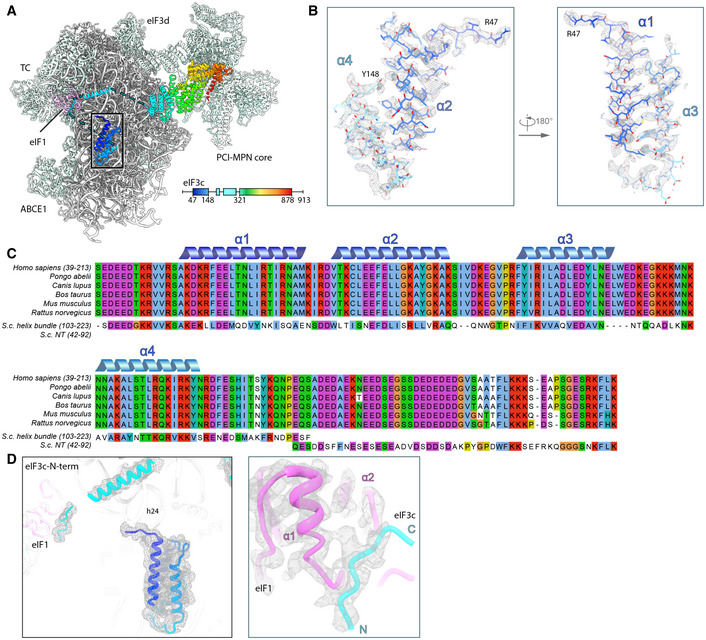
Figure EV5. Model fitting and sequence alignment of the eIF3c‐NTD.

- Overview of the TC‐containing human 43S PIC as shown in Fig 6 and scheme indicating the parts of eIF3c modeled. Black box indicates section of eIF3c highlighted in (B).
- Zoomed views highlighting fits of the eIF3c‐NTD 4‐helix bundle into the refined density (gray transparent mesh). The N‐ and C‐terminal residues are marked.
- MSA of the conserved N‐terminal region of eIF3c in mammals (Ser39‐Lys213 in H.s.), aligned with segments of the NTD from S.c.. Coloring according to default Clustal X color scheme (blue: hydrophobic, magenta: negative charge, red: positive charge, green: polar, orange: glycine, yellow: proline, pink: cysteine, cyan: aromatic). The 4‐helix bundle shows 31.1/67.2% sequence identity/similarity, and the eIF1‐interacting stretch present in the N‐terminus of S.c. eIF3c (Gln42‐Lys92) shows 32.0/56.0% sequence identity/similarity with a mammalia‐specific insert C‐terminal of the conserved 4‐helix bundle.
- eIF3c‐NTD in the human 43S PIC fitted into the cryo‐EM map and zoomed view showing the fit of the eIF1‐interacting stretch of eIF3c into the cryo‐EM map.
