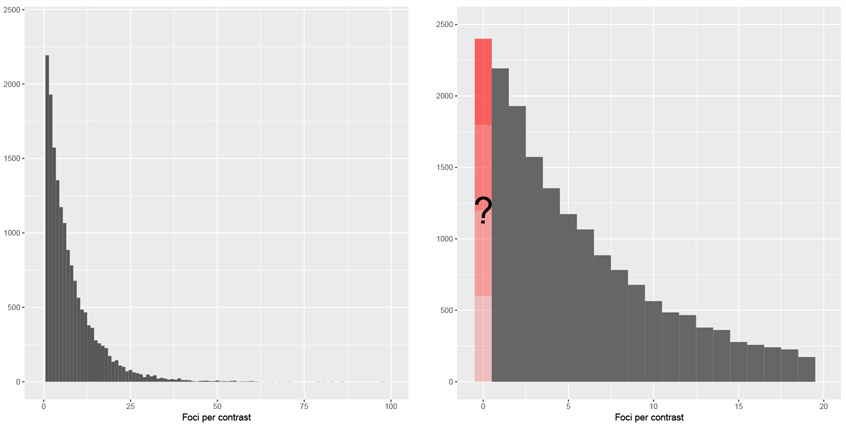
Figure 2:
Empirical distribution of the total number of foci per contrast in the BrainMap database, ni. The left panel shows the full distribution, while the right panel shows a zoomed-in view of all experiments reporting 24 or fewer foci. The BrainMap database does not record incidents of null contrasts (contrasts in a paper for which ni = 0).

