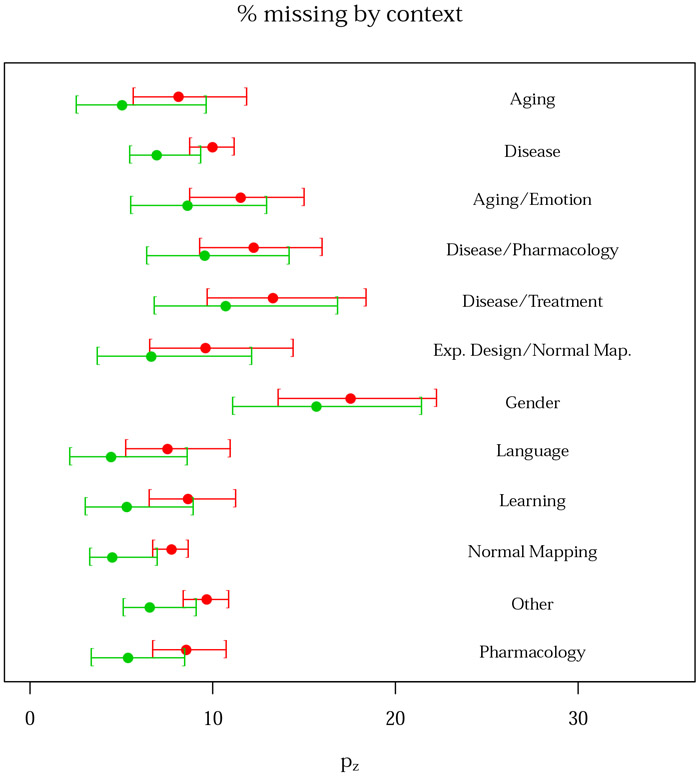
Figure 6:
Contrasts missing per 100 published as a function of experiment context, with 95% bootstrap confidence intervals. Note that we have fixed the year and square root sample size covariates to their median values. The plot is derived from the second BrainMap random sample (subsample B). The red and green lines represent the Negative Binomial and Delaporte distributions, respectively.

