Figure 3.
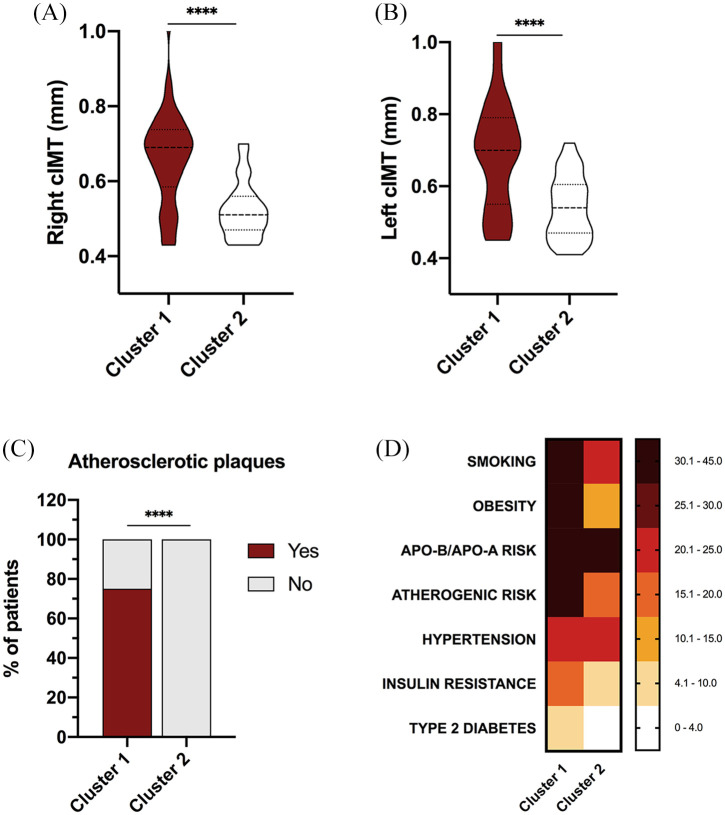
Cluster analysis recognizes two different phenotypes of axSpA patients according to their cardiovascular risk burden in terms of presence of carotid plaques and right and left cIMT levels. (A) Levels of right cIMT in cluster 1 and cluster 2. (B) Levels of left cIMT in cluster 1 and cluster 2. (C) Presence/absence of atherosclerotic plaques in cluster 1 and cluster 2. (D) Cluster analysis including presence of carotid plaques and right and left cIMT levels as variables distinguished two different phenotypes of patients with different cardiometabolic risk factors prevalence.
****p <0.0001.
Apo A, apolipoprotein A; Apo B, apolipoprotein B; axSpA, axial spondyloarthritis; cIMT, carotid intima media thickness.

