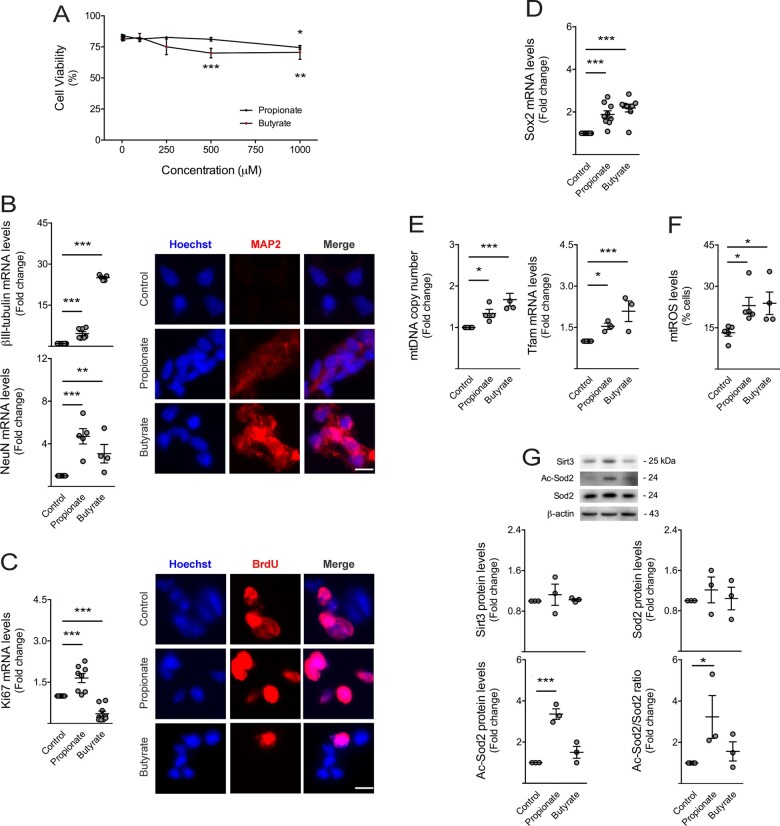
Figure 6.
Short-chain fatty acids stimulate neuronal differentiation, mitochondrial biogenesis and oxidative stress of NSCs. Mouse NSCs were treated with 1, 5, 10, 100, 250, 500 or 1000 μM of propionate (n = 3–9) and butyrate (n = 3–8) in self-renewal conditions. After 24 h of propionate and butyrate treatment, cells were collected for viability, mitochondrial mass, qRT-PCR, immunocytochemistry and Western blot analysis, whereas cells treated with only 2 h of these SCFAs were collected for mtROS, as described in Materials and methods section. (A) Effect of SCFAs on NSC viability, assessed by Guava ViaCount flow cytometry. Data are expressed by percentages of viable cells. Effect of SCFAs on (B, left) βIII-tubulin and NeuN, and (C, left) Ki67 and (D) Sox2 mRNA levels in NSCs. Hprt was used as loading control. Data are expressed as fold change over control (untreated cells). Representative images of immunofluorescence detection of cells labelled with anti-MAP2 (B, right) and anti-BrdU (C, right) antibodies. Nuclei were stained with Hoechst 33258. Scale bar, 5 μm. (E) Effect of SCFAs on mitochondrial biogenesis markers in NSCs. Quantification of relative mtDNA copy number (left) assessed by qPCR analysis of mitochondria-encoded gene mt-Co1. Nuclear Rn18s was used as loading control. Quantification of Tfam expression levels (right) assessed by qRT-PCR. Hprt was used as loading control. (F) Effect of SCFAs on mtROS levels in NSCs, assessed by flow cytometry. Data are expressed by percentages of cells stained with MitoSOX™ Red reagent. (G) Representative immunoblots (top) of Sirt3, total Sod2 and Ac-Sod2 protein levels and respective densitometry analysis (bottom). β-Actin was used as loading control. Data are expressed as fold change over control. Data represent mean values ± SEM for at least three independent experiments. *P < 0.05, **P < 0.01 and ***P < 0.001 compared to control cells.

