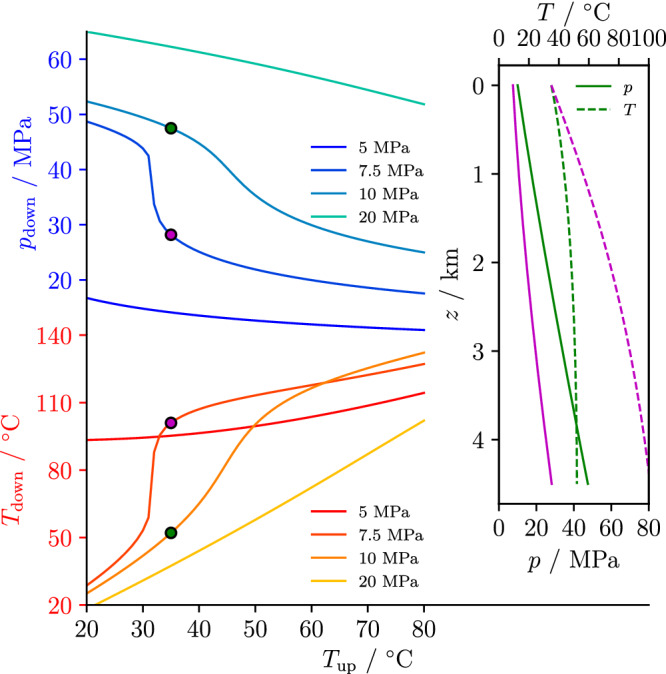
Figure 1.

CO2 injection conditions at the wellhead and downhole. Each curve shows the pressure, pdown, and temperature, Tdown, conditions at depth of injection (4.5 km) for several wellhead pressures and as a function of wellhead temperature, Tup. Injecting CO2 at a higher wellhead temperature implies that it reaches the reservoir depth with a lower pressure: In order to ensure injectivity into the rock formation, a minimum downhole pressure threshold should be guaranteed and can therefore be achieved by increasing the wellhead pressure. The sharp transition in the curves corresponding to a wellhead pressure of 7.5 MPa is connected to the phase transition from liquid to supercritical close to the critical point, around which abrupt changes in density take place. The inset displays the evolution of CO2 pressure and temperature along the wellbore depth for two different cases, indicated by points in the main figure (color corresponding to two different wellhead conditions). Because of the adiabatic hypothesis, the heating of CO2 is a consequence of pressure increase along the wellbore.
