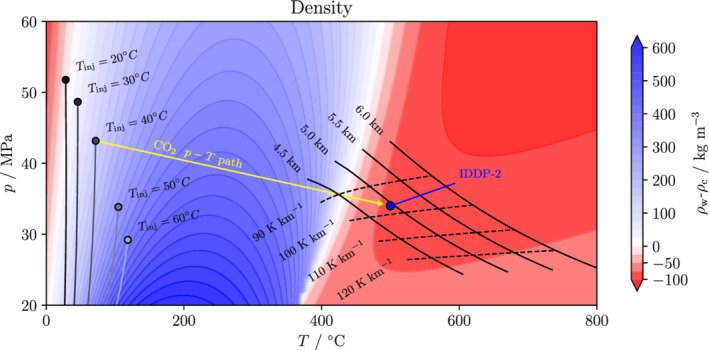
Figure 2.

Density difference map between water and CO2. The figure shows the density difference between water and CO2 as a function of pressure (up to 60 MPa) and temperature (up to 800°C). Positive (in blue) values indicate that CO2 has a lower density than water, which leads to CO2 buoyancy, and negative (in red) values indicate that CO2 has a higher density than water, leading to sinking potential in the reservoir. The downhole conditions of IDDP‐2 are temperature of 500°C and pressure of 34 MPa, which would lead to CO2 sinking potential. The dotted black lines indicate the p–T conditions of a hydrostatic water column for a variety of geothermal gradients and the solid black lines are isodepth for the same case. The trajectories on the left‐hand side indicate CO2 injection conditions at the reservoir for several wellhead temperatures and for a wellhead pressure of 10 MPa. The yellow line connects the downhole conditions (buoyant) of a hypothetical injection at IDDP2 with the CO2 conditions (sinking) within the reservoir far from the injection well.
