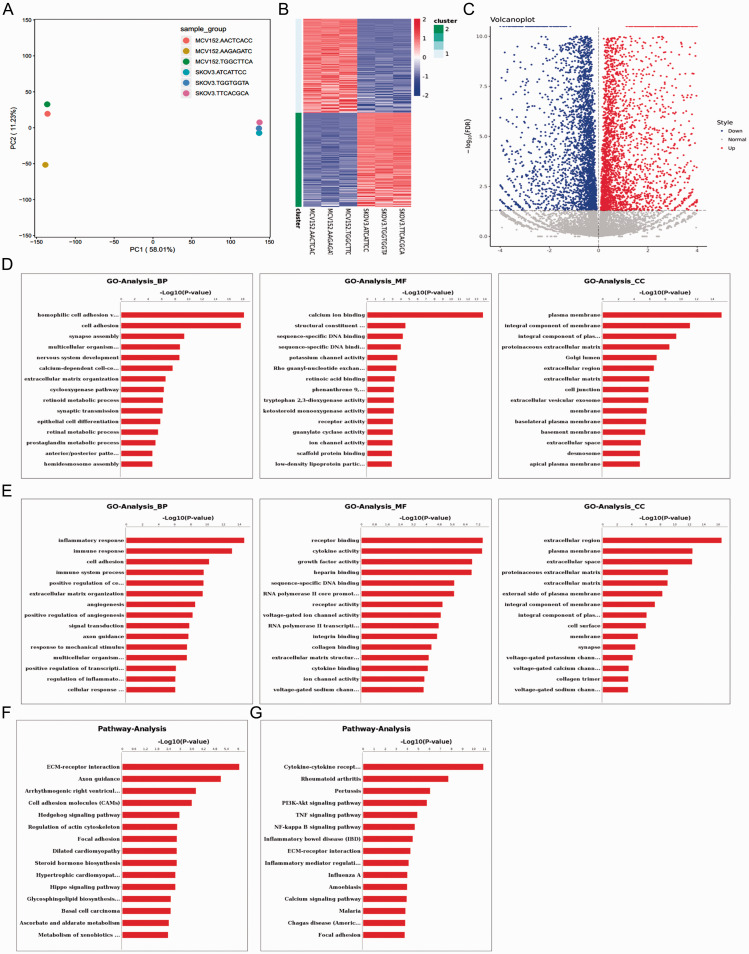
Figure 1.
Bioinformatics data analysis of differential gene expression between MCV152 and SKOV-3 cell lines, showing: (A) Principal component analysis by mapping all samples in a two-dimensional diagram composed of the largest component and the second largest component. Gene expression differences were small and correlation was good for RNA-seq samples with short distance; (B) Heatmap of differentially expressed genes (x axis, plotted according to sample name; y axis, plotted according to gene name); (C) Volcano plot of differentially expressed genes (x axis, log2 fold change; y axis, –log10 false discovery rate [FDR]). Red represents upregulated gene, and blue represents downregulated gene; (D) Upregulated genes and (E) downregulated genes in terms of enriched gene ontology (GO) functions, comprising biological process (BP), molecular function (MF) and cellular component (CC); and (F) Upregulated genes and (G) downregulated genes in terms of enriched pathways.

