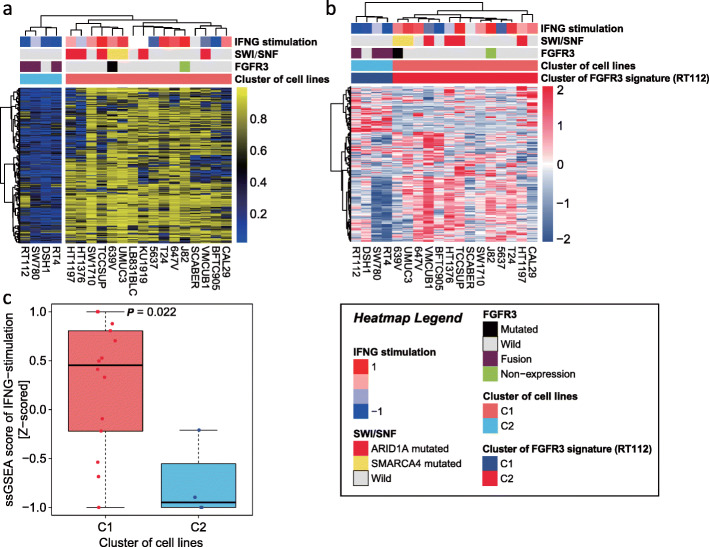
Fig. 6.
a Supervised clustering using hypermethylated probes derived from UTUC EpiC-high vs EpiC-low clusters and showing two subgroups of bladder cancer cell lines linked with SWI/SNF mutations (C1) and FGFR3 translocation status (C2). Note that the probes depicted in the heatmap were those that were statistically significant. b Supervised clustering extracted from Mahe of bladder cancer cell lines according to FGFR3 gene expression signature (using RT112 bladder cancer cell line). Note that although the DSH1 cell line does not harbor any FGFR3 mutation, it clusters with the three other cell lines harboring FGFR3 fusions and shares a similar transcriptomic program. c Box plot for interferon-γ stimulation signature score using single-sample gene set enrichment analysis (ssGSEA) in C1 and C2 clusters

